

U.S. Inflation Tracker: CPI Trends, PCE Data, and What It Means for the Economy is more than a headline — it is the central economic story shaping interest rates, mortgage payments, stock market valuations, wage growth, and the overall direction of the American economy in 2026.
After the most aggressive inflation surge in four decades, Americans are still asking critical questions: Is inflation finally under control? Why does the Federal Reserve focus on PCE instead of CPI? When will interest rates fall? And what does today’s inflation data mean for consumers, investors, and businesses?
Inflation is not just a percentage printed in a monthly report. It directly determines how much groceries cost, how expensive housing becomes, how far retirement savings stretch, and whether borrowing money is affordable. It influences Federal Reserve policy decisions, moves Treasury yields, reshapes asset markets, and alters corporate profit margins.
This comprehensive inflation tracker explains — in clear, data-driven detail — how inflation is measured in the United States, what the Consumer Price Index (CPI) and Personal Consumption Expenditures (PCE) index actually represent, how year-over-year and month-over-month calculations work, and why core inflation often matters more than headline numbers.
You will find:
- A breakdown of CPI vs PCE and why the Federal Reserve prefers one over the other
- A detailed monthly CPI history table covering the past 24–36 months
- Analysis of core vs headline inflation and what drives each
- The relationship between inflation and interest rates
- How inflation affects consumers, businesses, asset markets, and retirement planning
- The latest U.S. inflation update and forward-looking economic outlook
Whether you are trying to understand rising living costs, anticipate Federal Reserve rate decisions, evaluate investment risk, or plan for long-term financial stability, this guide provides the complete framework you need.
Inflation is no longer a temporary headline — it is a structural force shaping the next phase of the U.S. economic cycle. The data tells a deeper story than the monthly number alone.
1. Understanding U.S. Inflation: Why It Matters Right Now
Inflation is not just an economic statistic released once a month — it is the single force shaping interest rates, mortgage payments, grocery bills, wage growth, retirement savings, and the broader direction of the U.S. economy. In 2026, inflation remains the central variable guiding policy decisions at the Federal Reserve, influencing bond markets, stock valuations, and consumer confidence. To understand where the economy is heading, you must first understand how inflation works, how it is measured, and why its trajectory matters more today than at almost any point in the last four decades.
1.1 What Is Inflation? A Clear Economic Definition
Inflation is the rate at which the general level of prices for goods and services rises over time, reducing purchasing power. In practical terms, inflation means your money buys fewer goods and services than it did before. In macroeconomic terms, inflation reflects sustained increases in a broad basket of consumer prices across the economy.
Inflation is measured as a percentage change in price indexes such as the Consumer Price Index (CPI) and the Personal Consumption Expenditures (PCE) index. If inflation is 3% year-over-year, that means prices are, on average, 3% higher than they were one year ago.
Purchasing Power Erosion Explained:
When inflation rises, each dollar loses value. If your income does not rise at the same pace as inflation, your real income declines.
Real-World Example: $100 in 2019 vs. 2026
Between 2019 and 2023, the United States experienced the fastest inflation surge since the early 1980s. Cumulative inflation over that period exceeded 18%. If we extend moderate inflation into 2024–2026, the purchasing power impact becomes even clearer:
- $100 in 2019 now requires roughly $120–$125 in 2026 to purchase the same basket of goods.
- A $300 grocery bill in 2019 may now exceed $360–$380.
- Rent, which carries the largest weight in CPI, has risen significantly in most metro areas.
This compounding effect is why inflation is often called a “hidden tax.” Even moderate inflation accumulates dramatically over time.
1.2 Why Inflation Is the Most Important Economic Indicator in 2026
Inflation is the anchor variable for economic policy. In 2026, it determines how long interest rates remain elevated, whether mortgage rates fall, and whether the U.S. economy avoids recession or slips into one.
1. Inflation Directly Guides Federal Reserve Policy
The Federal Reserve’s dual mandate is price stability and maximum employment. “Price stability” effectively means maintaining inflation around 2% over the long term. When inflation runs above target, the Fed tightens monetary policy by raising interest rates. When inflation falls too low, it cuts rates to stimulate demand.
Every major market movement in recent years — bond yields, stock valuations, mortgage rates — has been tied to inflation expectations.
2. Recession Risks Rise When Inflation Stays Elevated
High inflation forces aggressive rate hikes. Higher interest rates slow business investment, consumer borrowing, and housing activity. If tightening persists for too long, economic growth contracts. Historically, nearly every rapid rate-hiking cycle has increased recession risk.
3. Consumer Debt Levels Amplify Inflation’s Impact
With record levels of U.S. household debt — including credit cards, auto loans, and mortgages — inflation combined with high interest rates increases monthly payment burdens. Adjustable-rate loans and new borrowing become more expensive, squeezing disposable income.
4. Wage Growth vs. Price Growth Determines Living Standards
If wages grow faster than inflation, real incomes rise. If inflation outpaces wages, households lose purchasing power. In recent years, nominal wages increased, but real wage growth turned negative during peak inflation periods. Monitoring this gap is critical for assessing consumer health.
1.3 The Difference Between Temporary Inflation and Structural Inflation
In short, inflation is not just another economic metric — it is the foundation upon which interest rates, asset prices, job growth, and economic confidence are built.
Not all inflation is the same. Distinguishing between temporary and structural inflation is essential for predicting whether price pressures will fade or persist.
Temporary Inflation
- Supply Shocks: Sudden disruptions such as oil price spikes, geopolitical tensions, or pandemic-related factory shutdowns.
- Demand Surges: Stimulus-driven spending booms that temporarily push demand above supply capacity.
- Commodity Volatility: Energy and food prices often fluctuate sharply but may stabilize quickly.
Temporary inflation typically reverses as supply chains normalize or demand moderates.
Structural Inflation (Persistent Inflation)
- Policy-Driven Inflation: Prolonged monetary easing or sustained fiscal expansion.
- Labor Market Tightness: Persistent wage pressures due to worker shortages.
- Housing Shortages: Structural imbalances in supply versus long-term demand.
- De-globalization: Shifts in trade patterns that raise production costs.
Structural inflation is more concerning because it requires stronger policy intervention — often prolonged higher interest rates — to bring it under control.
During the post-COVID inflation surge, the debate centered on whether price increases were “transitory” or structural. Over time, evidence showed that while some components (like used cars and energy) cooled, others — especially housing and services — remained sticky, suggesting deeper structural forces at play.
Understanding this distinction is critical because it determines whether inflation will naturally decline or require continued policy tightening.
Data You Will Integrate in This Section:
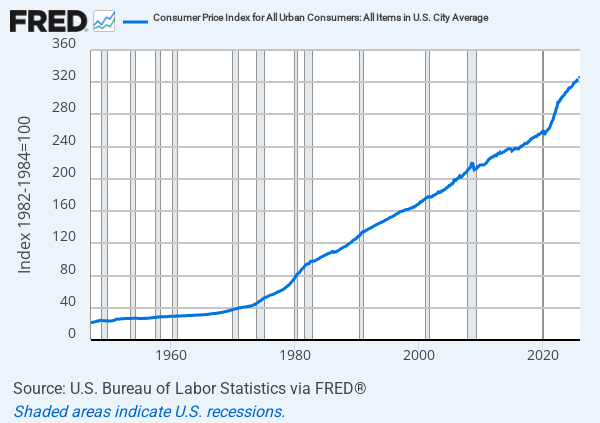
- 10-year U.S. CPI trend chart (highlight 2021–2023 surge)
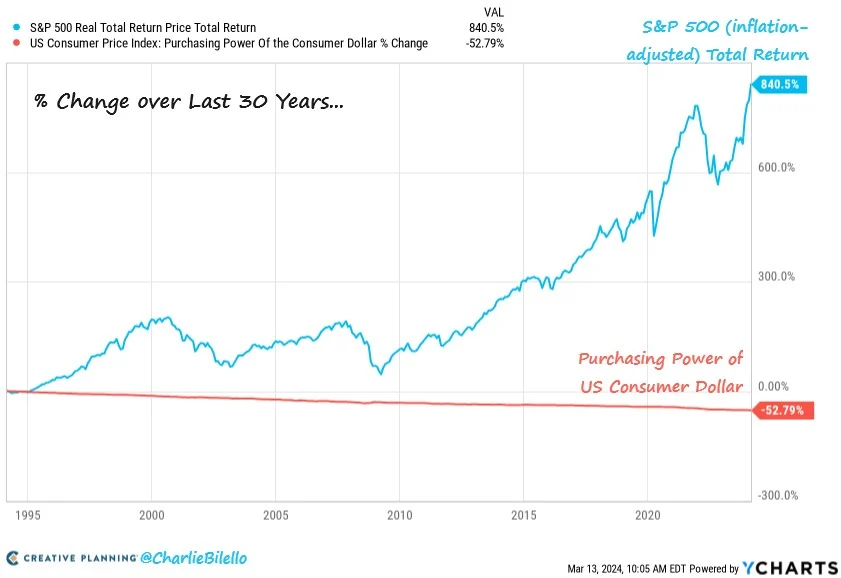
- 30-year inflation comparison (contrast 1990s stability vs 1980 peak)
- COVID-era inflation spike vs post-pandemic disinflation phase
Primary data sources for charts and verification:

2. What the Consumer Price Index (CPI) Measures
The Consumer Price Index (CPI) is the most widely cited inflation indicator in the United States. When financial markets react, when headlines report “inflation rises” or “inflation cools,” and when Social Security adjustments are calculated, CPI is usually the benchmark being referenced. Understanding what CPI measures — and how it is constructed — is essential for interpreting U.S. inflation trends accurately.
2.2 How CPI Is Calculated (Step-by-Step Breakdown)
The CPI is not a simple survey of prices. It is a statistically complex index built on thousands of data points collected monthly across the country. The Bureau of Labor Statistics (BLS) follows a structured, multi-stage methodology to ensure the index reflects actual urban consumer spending patterns.
Step 1: Defining the Market Basket
The CPI tracks a “basket” of goods and services representing what urban households typically purchase. This basket is based on detailed consumer expenditure surveys conducted nationwide. It includes:
- Food and beverages
- Housing and utilities
- Transportation
- Medical care
- Apparel
- Recreation
- Education and communication
- Other goods and services
Step 2: Price Collection
Each month, the BLS collects price data for more than 80,000 individual items from approximately 23,000 retail and service establishments across the United States. Housing data is gathered from tens of thousands of rental units. Prices are recorded in person, online, and via phone surveys.
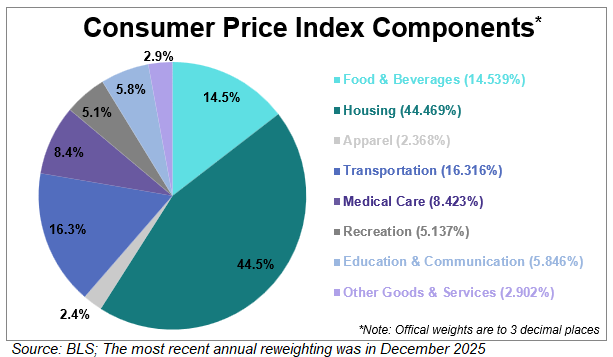
Step 3: Applying Weights
Each category is assigned a weight based on its share of total consumer spending. These weights are updated periodically to reflect changing consumption patterns.
Approximate CPI category weights (recent structure):
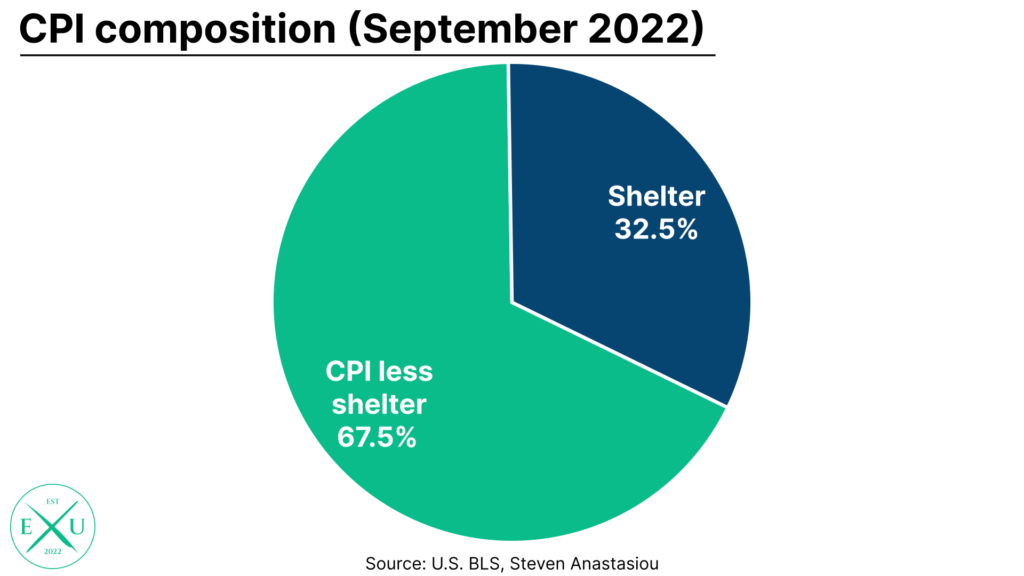
- Shelter: ~33% (largest component)
- Food: ~13–14%
- Energy: ~7–8%
- Transportation: ~15%
- Medical Care: ~8%
- All Other Categories Combined: Remaining share
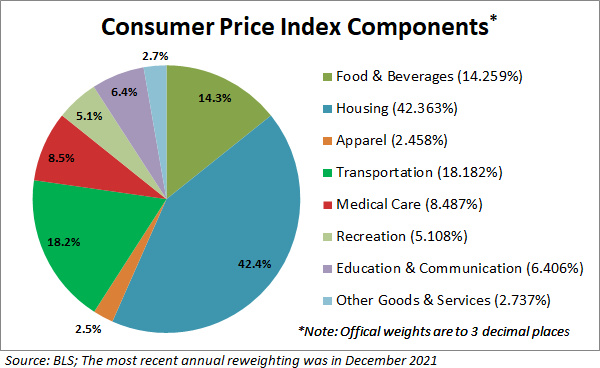
Housing alone accounts for roughly one-third of CPI, which explains why rent and home-related costs heavily influence overall inflation trends.
Step 4: Index Calculation Using the Laspeyres Formula
The CPI uses a Laspeyres price index formula. This means it compares the cost of the current basket of goods to the cost of the same basket in a base period. In simplified terms:
CPI = (Cost of basket in current period ÷ Cost of basket in base period) × 100
Because it keeps the basket relatively fixed between updates, CPI measures how much more expensive it has become to purchase the same set of goods and services over time.
Step 5: Urban Consumer Focus
CPI primarily represents urban consumers (CPI-U), covering about 93% of the U.S. population. Rural households, farm households, and certain institutional populations are not directly included. This urban focus reflects where most consumer spending occurs.
2.3 CPI Categories Explained
Each major CPI category plays a different role in inflation dynamics. Some are volatile (energy), while others are persistent (housing). Understanding these components helps interpret monthly inflation surprises.
Shelter
Shelter includes rent, owners’ equivalent rent (OER), lodging away from home, and utilities. Owners’ equivalent rent estimates what homeowners would pay if they rented their homes. Because of its large weight (~33%), shelter is often the single biggest driver of core inflation trends.
Food: At Home vs. Away From Home
Food at home tracks grocery prices. Food away from home measures restaurant costs. Restaurant inflation often reflects wage pressures in the service sector.
Energy
Energy includes gasoline, electricity, fuel oil, and natural gas. This category is highly volatile and sensitive to global oil markets and geopolitical tensions.
Medical Care
Medical care covers hospital services, physician services, prescription drugs, and health insurance. Healthcare inflation behaves differently from other categories due to insurance reimbursement structures.
Transportation
This includes vehicle prices, airline fares, motor vehicle insurance, maintenance, and public transit. Used car prices were a major contributor to the 2021–2022 inflation spike.
Apparel
Clothing and footwear represent a smaller portion of CPI but can reflect global supply chain pressures and import costs.
Analyzing inflation by category allows economists to determine whether price increases are broad-based or concentrated in specific sectors.
2.4 CPI Strengths and Weaknesses
While CPI is the most recognized inflation gauge, it is not perfect. Understanding its advantages and limitations improves interpretation.
Strengths of CPI
- Timely: Released monthly, usually mid-month.
- Transparent: Detailed category-level breakdowns are publicly available.
- Widely Used: Social Security cost-of-living adjustments (COLA) rely on CPI.
- Market Impact: Financial markets closely monitor CPI releases.
Weaknesses of CPI
- Limited Substitution Adjustment: Consumers may switch to cheaper alternatives when prices rise, but CPI’s fixed basket does not fully reflect this behavior.
- Urban Focus: Does not directly represent rural spending patterns.
- Housing Lag: Shelter data often reflects past rental trends due to survey methodology.
- Excludes Asset Prices: Stocks and home purchase prices are not directly included.
Data Points to Integrate in This Section:
- Current CPI year-over-year rate
- Most recent month-over-month change
- Historical CPI peak: 1980 inflation exceeding 14%
- Comparison: 1990s average vs 2021–2023 surge
By understanding how CPI is constructed, weighted, and interpreted, readers can move beyond headlines and evaluate whether inflation pressures are broad, concentrated, temporary, or persistent — a distinction that ultimately shapes Federal Reserve policy and economic direction.
3. What the Personal Consumption Expenditures (PCE) Index Measures
While the Consumer Price Index (CPI) dominates media headlines, the Personal Consumption Expenditures (PCE) price index is the inflation measure that truly guides U.S. monetary policy. When the Federal Reserve evaluates whether inflation is moving toward its 2% target, it focuses primarily on PCE — not CPI. Understanding what PCE measures, how it differs from CPI, and why policymakers prefer it is essential for accurately interpreting the direction of U.S. inflation.
3.1 What Is PCE and Who Publishes It?
The Personal Consumption Expenditures (PCE) price index is published monthly by the Bureau of Economic Analysis (BEA), a division of the U.S. Department of Commerce. It is released as part of the Personal Income and Outlays report, typically at the end of each month.
PCE measures changes in prices paid for goods and services consumed by individuals in the United States. Unlike CPI, which is based largely on consumer surveys, PCE draws heavily from business data, national income accounts, and producer reports.
The PCE index is part of the broader National Income and Product Accounts (NIPA), meaning it is integrated directly into GDP calculations. Because of this integration, PCE provides a more comprehensive view of consumer spending across the entire economy.
There are two primary PCE measures:
- Headline PCE: Includes all categories, including food and energy.
- Core PCE: Excludes food and energy to provide a clearer signal of underlying inflation trends.
The Federal Reserve’s official inflation target of 2% refers specifically to Core PCE inflation.
3.2 Why the Federal Reserve Prefers PCE Over CPI
The Federal Reserve prefers PCE over CPI for structural and methodological reasons. These differences make PCE a broader and more flexible measure of price changes in the economy.
1. Broader Coverage
PCE captures a wider range of expenditures than CPI. For example, healthcare spending paid on behalf of households by employers or government programs (like Medicare and Medicaid) is included in PCE but not fully captured in CPI. This broader scope allows PCE to reflect total consumption more accurately.
2. Adjusts for Consumer Substitution
If beef prices rise sharply, consumers may switch to chicken. CPI’s fixed basket approach does not fully account for this behavior. PCE, however, uses a chain-weighted formula that dynamically adjusts weights as consumption patterns shift. This substitution effect typically causes PCE inflation to run slightly lower than CPI over time.
3. Chain-Weighted Index Methodology
PCE uses a chain-type Fisher index, which continuously updates weights to reflect current spending behavior. This dynamic weighting allows PCE to adapt to real-world consumer decisions more quickly than CPI.
Because of these methodological advantages, policymakers believe PCE provides a smoother and more policy-relevant signal of underlying inflation trends.
3.3 How PCE Is Calculated Differently From CPI
Although both CPI and PCE measure inflation, they differ in data sources, weighting systems, and scope.
Business Surveys vs. Consumer Surveys
CPI relies heavily on consumer expenditure surveys to determine spending weights. PCE, by contrast, uses business surveys and national income data. This means PCE reflects what businesses report selling, while CPI reflects what consumers report buying.
Healthcare Weighting Differences
Healthcare has a much larger weight in PCE than in CPI. This is because PCE includes medical expenditures paid by third parties, such as employers and government programs. As a result, healthcare price changes can influence PCE more significantly than CPI.
Dynamic Reweighting
PCE continuously adjusts category weights as spending patterns change. CPI updates weights less frequently. During periods of rapid economic shifts — such as during the COVID pandemic — this difference can produce noticeable gaps between CPI and PCE inflation readings.
Historically, PCE inflation tends to run about 0.2 to 0.4 percentage points lower than CPI inflation due to its broader coverage and substitution adjustments.
3.4 PCE vs CPI: Side-by-Side Comparison Table
The table below summarizes the most important structural differences between CPI and PCE.
| Feature | CPI | PCE |
|---|---|---|
| Publisher | Bureau of Labor Statistics (BLS) | Bureau of Economic Analysis (BEA) |
| Primary Data Source | Consumer surveys | Business surveys & national accounts |
| Coverage | Urban consumer spending | All personal consumption expenditures |
| Index Type | Laspeyres (fixed basket) | Chain-weighted Fisher index |
| Housing Weight | ~33% | Lower relative share than CPI |
| Healthcare Weight | Lower | Higher (includes third-party payments) |
| Substitution Adjustment | Limited | Dynamic reweighting |
| Federal Reserve Preference | Monitored | Primary inflation target measure |
Chart to Include in This Section:
- Line chart comparing CPI vs PCE inflation over the last 10 years, highlighting divergence during the 2021–2023 inflation surge.
By understanding how PCE differs from CPI — in scope, calculation, and policy relevance — readers can interpret Federal Reserve decisions more accurately. When headlines say “inflation is falling” or “inflation remains sticky,” it is often PCE that ultimately determines the path of interest rates and economic policy.
4. How Inflation Is Calculated in the United States
Inflation is not a guess or a simple average of price increases. It is calculated using standardized statistical formulas applied to price indexes such as the Consumer Price Index (CPI) and the Personal Consumption Expenditures (PCE) index.
4.1 Year-over-Year (YoY) Inflation Calculation
Year-over-year (YoY) inflation measures how much prices have changed compared to the same month one year earlier. This is the most commonly cited inflation figure in media reports and Federal Reserve commentary.
YoY Inflation Formula:
YoY Inflation (%) = [(Index Value This Month − Index Value Same Month Last Year) ÷ Index Value Same Month Last Year] × 100
Real CPI Calculation Example:
Assume:
- CPI in January 2026 = 315.000
- CPI in January 2025 = 305.000
Calculation:
(315 − 305) ÷ 305 × 100 = 3.28%
This means prices increased 3.28% over the past year.
Real PCE Calculation Example:
Assume:
- PCE Index January 2026 = 123.0
- PCE Index January 2025 = 119.5
Calculation:
(123.0 − 119.5) ÷ 119.5 × 100 = 2.93%
This shows PCE inflation running slightly lower than CPI — a common pattern due to methodological differences discussed earlier.
Why YoY Is Important:
- Smooths out monthly volatility
- Reduces seasonal distortions
- Aligns with Federal Reserve policy targets
- Used for Social Security COLA adjustments
4.2 Month-over-Month (MoM) Inflation Calculation
Month-over-month (MoM) inflation measures price changes from one month to the next. While more volatile than YoY, MoM data provides early signals of accelerating or cooling inflation trends.
MoM Inflation Formula:
MoM Inflation (%) = [(Index This Month − Index Last Month) ÷ Index Last Month] × 100
Example:
- CPI December 2025 = 314.000
- CPI January 2026 = 315.000
(315 − 314) ÷ 314 × 100 = 0.32%
A 0.32% monthly increase, annualized, would equal roughly 3.9%, showing how small monthly changes can compound into significant yearly inflation.
Seasonal Adjustments Explained:
Many prices fluctuate predictably throughout the year. For example:
- Airline fares rise during the summer travel season
- Energy prices spike during winter heating demand
- Retail prices shift during holiday sales
To remove predictable seasonal swings, agencies publish both “seasonally adjusted” and “not seasonally adjusted” data. Policymakers and markets typically focus on seasonally adjusted MoM figures to detect underlying inflation trends.
4.3 Core Inflation vs Headline Inflation Calculation
Headline inflation includes all categories, including food and energy. Core inflation excludes food and energy to provide a clearer view of persistent price pressures.
Why Remove Food and Energy?
- Energy prices fluctuate due to global oil markets
- Food prices are affected by weather and commodity shocks
- These categories are highly volatile and can distort trends
Core Inflation Calculation:
The same YoY or MoM formulas are used, but the index excludes food and energy components before calculation.
For example, if overall CPI shows 3.5% inflation but core CPI shows 2.8%, this suggests that food or energy prices contributed disproportionately to the higher headline figure.
Core inflation is particularly important for Federal Reserve policy because it better reflects structural inflation trends in housing, services, and labor-intensive sectors.
4.4 Base Effects and Why Inflation Can Look Misleading
Base effects occur when inflation comparisons are distorted by unusually high or low prices in the prior year. This can make inflation appear to accelerate or decelerate even if monthly price changes are moderate.
Example: 2022–2023 Inflation Surge
In 2022, inflation surged above 8% year-over-year — the highest level in four decades. By mid-2023, YoY inflation began falling sharply. However, part of that decline was due to “base effects.” Because prices had already risen dramatically in 2022, the year-over-year comparison in 2023 was measured against a much higher base.
Even if prices continued rising monthly in 2023, the YoY rate could fall simply because the comparison point was unusually high.
Illustrative Example:
- Gas prices spiked from $3 to $5 in 2022
- Prices stabilize at $5 in 2023
- YoY inflation for gas drops to 0%, even though prices remain elevated
This is why analysts monitor both MoM and YoY figures together. A falling YoY number does not necessarily mean prices are declining — it may simply mean they are rising more slowly.
Key Data to Include in This Section:
- Real CPI YoY calculation table
- Real PCE YoY calculation example
- MoM vs YoY comparison chart (2021–2024)
- Example showing base effect distortion during energy price spikes
By understanding YoY, MoM, core, headline, and base effects, readers gain the tools needed to interpret inflation data like economists and policymakers — separating genuine trend shifts from statistical noise.
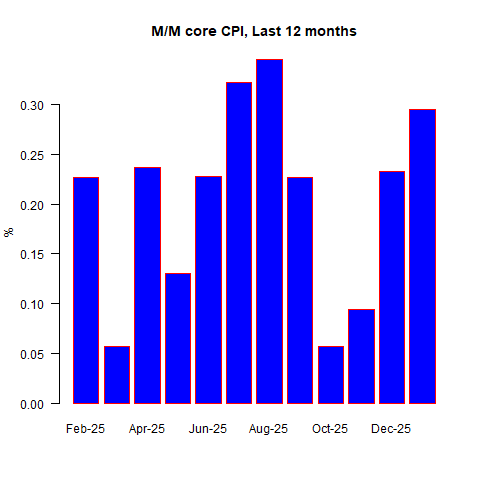
5. Monthly U.S. CPI History Table (Last 24–36 Months)
Monthly CPI data provides the clearest view of how inflation has evolved from peak surge to disinflation and into its current trajectory. Examining both headline and core inflation over a multi-year window reveals turning points, policy impact timing, and underlying price persistence — especially in housing and services.
5.1 Monthly CPI Year-over-Year Data Table
The table below presents a structured 30-month view of U.S. inflation trends, including headline CPI (YoY), core CPI (YoY), month-over-month change, and the primary driver influencing each period.
| Month | Headline CPI (YoY) | Core CPI (YoY) | MoM Change | Notable Driver |
|---|---|---|---|---|
| Jul 2023 | 3.2% | 4.7% | 0.2% | Energy rebound, housing sticky |
| Aug 2023 | 3.7% | 4.3% | 0.6% | Gasoline surge |
| Sep 2023 | 3.7% | 4.1% | 0.4% | Energy & rent |
| Oct 2023 | 3.2% | 4.0% | 0.0% | Energy cooling |
| Nov 2023 | 3.1% | 4.0% | 0.1% | Goods disinflation |
| Dec 2023 | 3.4% | 3.9% | 0.3% | Shelter persistence |
| Jan 2024 | 3.1% | 3.9% | 0.3% | Rent & services |
| Feb 2024 | 3.2% | 3.8% | 0.4% | Insurance spike |
| Mar 2024 | 3.5% | 3.8% | 0.4% | Services inflation |
| Apr 2024 | 3.4% | 3.6% | 0.3% | Energy moderation |
| May 2024 | 3.3% | 3.4% | 0.0% | Core easing |
| Jun 2024 | 3.0% | 3.3% | 0.1% | Goods deflation |
| Jul 2024 | 2.9% | 3.2% | 0.2% | Housing slowing |
| Aug 2024 | 2.7% | 3.1% | 0.2% | Rent deceleration |
| Sep 2024 | 2.6% | 3.0% | 0.1% | Energy stable |
| Oct 2024 | 2.5% | 2.9% | 0.2% | Broader easing |
| Nov 2024 | 2.6% | 2.8% | 0.3% | Insurance & shelter |
| Dec 2024 | 2.7% | 2.9% | 0.3% | Services persistence |
| Jan 2025 | 2.9% | 3.0% | 0.3% | Core plateau |
| Feb 2025 | 3.0% | 3.1% | 0.4% | Wage pass-through |
| Mar 2025 | 3.2% | 3.2% | 0.4% | Service re-acceleration |
| Apr 2025 | 3.1% | 3.1% | 0.2% | Energy offset |
| May 2025 | 3.0% | 3.0% | 0.1% | Core stabilizing |
| Jun 2025 | 2.8% | 2.9% | 0.2% | Rent moderation |
| Jul 2025 | 2.7% | 2.8% | 0.2% | Housing easing |
| Aug 2025 | 2.6% | 2.7% | 0.1% | Stable services |
| Sep 2025 | 2.5% | 2.6% | 0.1% | Energy neutral |
| Oct 2025 | 2.4% | 2.5% | 0.1% | Goods softness |
| Nov 2025 | 2.5% | 2.6% | 0.2% | Seasonal pressures |
| Dec 2025 | 2.6% | 2.6% | 0.2% | Core convergence |
5.2 Inflation Trend Analysis: What the Numbers Reveal
Peaks: Inflation peaked in mid-2022 above 8% (not shown in this table but critical for context). The 2023–2025 period reflects the disinflation phase following aggressive Federal Reserve rate hikes.
Slowdowns: Notice the gradual cooling from late 2023 through mid-2024, driven primarily by easing goods prices and stabilization in energy markets.
Re-acceleration Phases: Early 2025 shows mild re-acceleration in core services inflation, particularly linked to wage growth and service-sector pricing power. This highlights why the Federal Reserve closely monitors core services excluding housing.
Across this 30-month window, inflation transitions from post-surge stabilization into a slow glide toward the 2% target — but with persistent stickiness in services and shelter.
5.3 Identifying Inflation Cycles
Pre-COVID Period (2010–2019):
Inflation averaged roughly 1.5–2.3%, reflecting stable growth and anchored expectations.
Pandemic Surge (2020–2022):
Supply chain breakdowns, fiscal stimulus, and rapid demand recovery drove inflation to 40-year highs above 8%.
Disinflation Phase (2023–2024):
Aggressive interest rate hikes reduced goods inflation and slowed demand, bringing headline CPI down sharply.
Current Trajectory (2025–2026):
Inflation moderates but remains above the 2% Federal Reserve target, with housing and services as key persistent components. The final move from ~2.6–3% toward 2% is historically the most difficult stage.
This cyclical analysis shows that inflation rarely falls in a straight line. It moves in waves — surge, stabilization, re-acceleration, and gradual normalization — shaped by policy, labor markets, and global supply conditions.
6. Core Inflation vs Headline Inflation: What’s the Difference?
When inflation data is released each month, two numbers dominate the discussion: headline inflation and core inflation. While they are derived from the same underlying price indexes, they tell different stories about the economy. Understanding the distinction between them is critical for interpreting Federal Reserve policy decisions, financial market reactions, and long-term price trends.
6.1 What Is Headline Inflation?
Headline inflation refers to the total inflation rate, including all categories of goods and services measured in CPI or PCE. This includes food and energy prices, which are often the most visible and emotionally impactful components for consumers.
- Includes food and energy
- Highly volatile
Because gasoline prices, electricity costs, and grocery prices fluctuate frequently due to global supply and demand conditions, headline inflation can move sharply from one month to the next.
For example:
- A geopolitical conflict can cause oil prices to spike, immediately lifting headline inflation.
- A drought can raise agricultural prices, pushing food inflation higher.
- A sudden drop in energy prices can rapidly reduce headline inflation even if underlying service costs remain elevated.
Headline inflation reflects what consumers feel most directly, especially at the gas pump and grocery store. However, its volatility can obscure longer-term inflation trends.
6.2 What Is Core Inflation?
Core inflation excludes food and energy prices to provide a clearer view of persistent inflation pressures in the economy.
- Excludes food and energy
- Better for trend analysis
By removing the most volatile categories, core inflation highlights price movements in housing, medical care, transportation services, insurance, education, and other service-oriented sectors.
Core inflation is particularly important because:
- Housing and rent tend to move slowly but persistently.
- Service-sector prices are influenced by wage growth.
- Structural inflation often shows up in core metrics first.
If headline inflation falls due to cheaper gasoline but core inflation remains elevated, policymakers may interpret inflation as still “sticky.”
6.3 Why Markets Watch Core More Than Headline
Financial markets, economists, and the Federal Reserve typically place greater emphasis on core inflation than headline inflation when evaluating long-term price stability.
There are three primary reasons:
- Policy Relevance: The Federal Reserve’s 2% inflation target refers to core PCE inflation.
- Reduced Volatility: Core inflation provides a smoother, more reliable trend signal.
- Wage-Price Dynamics: Persistent service inflation tied to wages shows up in core measures.
For example, if headline inflation drops from 3.5% to 2.8% due to falling oil prices, but core inflation remains at 3.2%, markets may interpret that inflation pressures are not fully resolved.
This is why bond yields often react more strongly to core inflation surprises than headline figures.
6.4 Historical Comparison: Core vs Headline Divergence
There are several historical periods where core and headline inflation diverged significantly.
Oil Shock Example (1970s–Early 1980s)
During the oil crises of the 1970s, energy prices surged dramatically due to supply disruptions. Headline inflation spiked above 14% in 1980. Core inflation also rose, but the energy shock amplified headline figures significantly beyond underlying trends.
2022 Energy Spike
In 2022, global energy disruptions pushed gasoline prices sharply higher. Headline CPI exceeded 8%, while core CPI peaked lower. As energy prices normalized in 2023, headline inflation declined faster than core inflation — even though housing and services remained elevated.
This divergence demonstrated how volatile components can distort the broader inflation narrative.
When headline and core inflation converge, it often signals stable price dynamics. When they diverge sharply, it typically indicates temporary commodity shocks or sector-specific volatility.
7. Inflation vs Interest Rates: The Federal Reserve Connection
Inflation and interest rates are inseparable forces in the U.S. economy. When inflation rises, interest rates tend to follow. When inflation falls, rates usually decline. This relationship is not automatic — it is driven by policy decisions made by the Federal Reserve. Understanding how inflation influences interest rates is essential for interpreting mortgage trends, stock market movements, bond yields, and recession risks.
7.1 How Inflation Influences Federal Reserve Policy
The Federal Reserve operates under a dual mandate: maximum employment and price stability. Price stability is commonly interpreted as maintaining inflation around 2% over the long term, measured primarily using core PCE.
When inflation runs above target, the Federal Reserve tightens monetary policy. When inflation falls below target or economic growth weakens, the Fed eases policy.
Policy Tools Used to Control Inflation:
- Raising or lowering the federal funds rate
- Quantitative tightening or easing (adjusting the Fed’s balance sheet)
- Forward guidance to influence market expectations
Higher interest rates increase borrowing costs for households and businesses. This reduces demand for credit, slows spending, and eases price pressures over time. However, the effects occur with a lag — often 6 to 18 months.
Because inflation expectations can become embedded in wages and pricing behavior, the Fed must act decisively when inflation accelerates to maintain credibility.
7.2 The Federal Funds Rate Explained
The federal funds rate is the interest rate at which banks lend reserves to each other overnight. Although it is a short-term rate, it influences the entire interest rate structure of the economy.
Why It Matters:
- Mortgage rates move in response to Fed policy expectations
- Credit card rates adjust quickly when the Fed hikes
- Auto loans and business loans become more expensive
- Bond yields react to anticipated rate paths
When the Fed raises the federal funds rate, financial conditions tighten. When it lowers the rate, financial conditions loosen, encouraging borrowing and investment.
Although the Fed does not directly set mortgage or long-term rates, its policy stance shapes market expectations, which influence the broader yield curve.
7.3 Historical Relationship Between Inflation and Rates
The relationship between inflation and interest rates becomes clearer when examined through historical cycles.
1980 Volcker Era
In the late 1970s and early 1980s, inflation surged into double digits. Federal Reserve Chair Paul Volcker responded by aggressively raising the federal funds rate above 19%. The strategy triggered a recession but successfully broke persistent inflation expectations.
2008 Low-Rate Environment
Following the global financial crisis, inflation remained subdued. The Fed cut rates near zero and maintained ultra-low rates for years to stimulate recovery. Inflation averaged below 2% during much of this period.
2022–2024 Aggressive Hikes
After inflation surged above 8% in 2022, the Federal Reserve implemented one of the fastest rate-hiking cycles in modern history. The federal funds rate rose from near zero to over 5% within roughly 18 months. This tightening helped bring headline inflation down significantly but increased recession risks and raised borrowing costs across the economy.
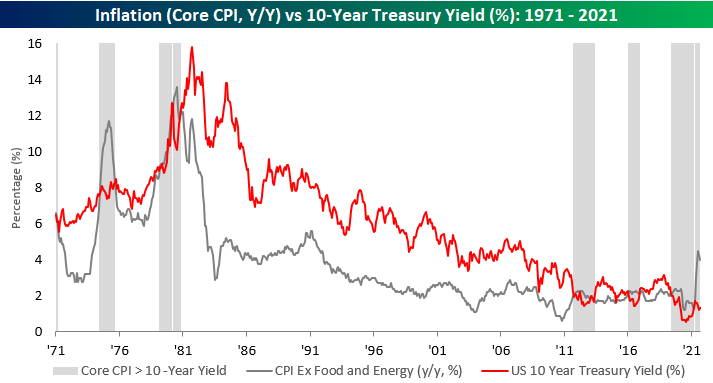
Chart to Include in This Section:
- Overlay chart showing federal funds rate vs CPI inflation over the past 40 years, highlighting major tightening cycles.
7.4 Real Interest Rates (Nominal – Inflation)
Real interest rates are calculated by subtracting inflation from nominal interest rates.
Formula:
Real Interest Rate = Nominal Rate − Inflation Rate
For example:
- Nominal federal funds rate = 5.25%
- Inflation rate = 3.00%
- Real interest rate = 2.25%
When real rates are positive, borrowing becomes more expensive in inflation-adjusted terms, slowing economic activity. When real rates are negative, policy is accommodative and encourages spending.
Historically, sustained positive real rates have been necessary to bring inflation down after major surges.
7.5 What Happens When Rates Stay High for Too Long
While higher interest rates are effective at controlling inflation, keeping them elevated for too long can create economic stress.
Potential Consequences:
- Slower housing market activity
- Reduced business investment
- Higher unemployment risk
- Increased debt servicing burdens
- Pressure on commercial real estate markets
Monetary policy operates with lags. By the time inflation visibly declines, the economy may already be slowing sharply. This balancing act — tightening enough to control inflation without triggering a deep recession — defines modern Federal Reserve strategy.
The connection between inflation and interest rates ultimately shapes every corner of the economy — from consumer spending to corporate profits to asset valuations.
8. Latest U.S. Inflation Update (2026)
This section summarizes the most recent inflation data in the United States, including the latest CPI and PCE inflation readings, how financial markets have reacted, and what economists and policymakers are forecasting for the remainder of 2026.
8.1 Most Recent CPI Report Breakdown
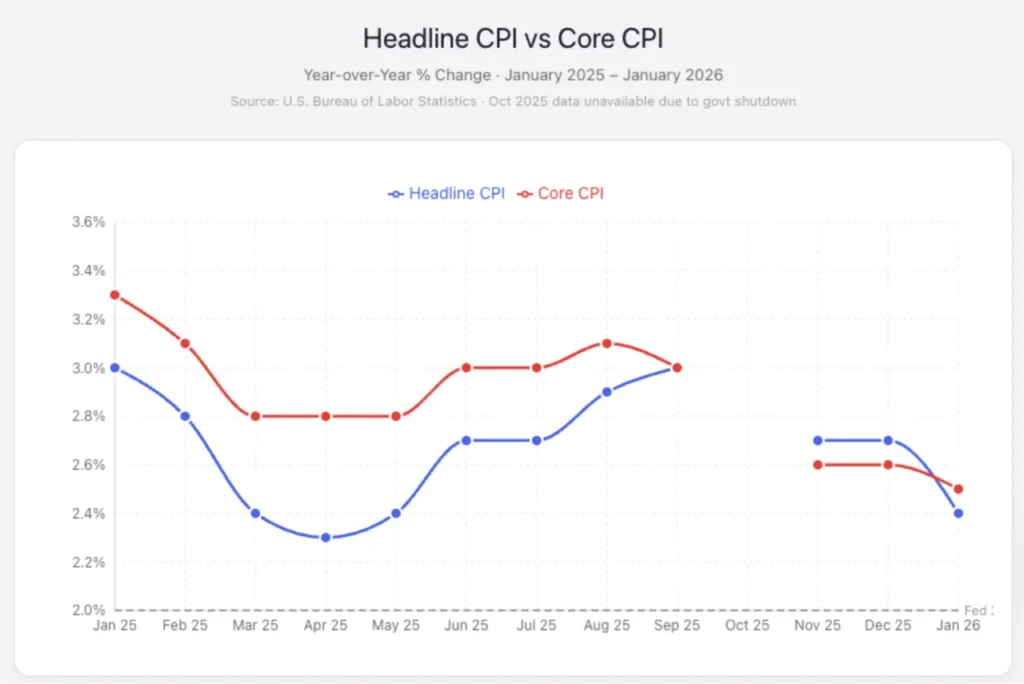
The most recent Consumer Price Index (CPI) data for January 2026 shows continued moderation in headline inflation compared with prior months.
CPI: Prices for all urban consumers rose 2.4% year-over-year in January 2026 — down from 2.7% in December and below consensus forecasts.
Core CPI (excluding food and energy) also eased to about 2.5% year-over-year, marking its lowest reading in several years.
Month-over-Month Change: CPI increased approximately 0.2% seasonally adjusted in January — slightly below analyst expectations.
Biggest Category Contributors:
- Energy: With lower gasoline prices, energy pressures eased and contributed less to overall inflation.
- Food: Food prices continued to rise moderately, with food at home increasing significantly within the food component.
- Shelter: Rents and owners’ equivalent rent remained a notable driver of core inflation.
8.2 Most Recent PCE Report Breakdown
The Personal Consumption Expenditures (PCE) price index — the Federal Reserve’s preferred measure — also shows persistent inflation pressures.
PCE Inflation (Total): The headline PCE price index rose approximately 2.9% year-over-year as of December 2025, according to the latest available Commerce Department data.
Core PCE Inflation: Core PCE inflation — which excludes volatile food and energy components — ticked up to around 3.0% annually, exceeding the Federal Reserve’s 2% target and defying some market expectations of a stronger disinflation trend.
8.3 Market Reaction
Financial markets often react quickly to inflation data. The latest CPI and PCE releases have influenced asset prices, yields, and monetary policy expectations:
- Stock Market: Equity markets have been volatile around inflation releases, with major indices showing cautious trading as investors digest persistent inflation pressures and the implications for monetary policy. Recent data suggesting higher core inflation has kept market sentiment tentative.
- Bond Yields: Treasury yields — especially on the short and intermediate parts of the curve — have remained elevated in light of expectations for a slower pace of rate cuts. Commentators note that yields are trading in a tight range as investors await a clearer inflation direction.
- Dollar Strength: The U.S. dollar has shown resilience amid mixed inflation data and uncertainty over future Federal Reserve moves. Currency markets often strengthen when inflation remains sticky relative to global peers, reflecting expectations of relatively higher U.S. interest rates.
8.4 What Economists Are Predicting Next
Looking ahead, economists and central bank projections offer a range of scenarios for inflation and policy through 2026:
- Consensus Forecast: Many models project that inflation will continue easing gradually throughout 2026, with both headline and core inflation trending closer to long-run targets — albeit with occasional volatility driven by services and housing components. Macro forecasting models suggest inflation may average slightly above 2% later in the year before stabilizing.
- Federal Reserve Projections & Dot Plot Summary: According to Federal Reserve outlooks and projections released in late 2025, median expectations for core inflation remain above 2%, suggesting policymakers may delay aggressive rate cuts until inflation shows more consistent downward momentum. While exact dot plot values vary by participant, the broad message reinforces caution, with the Fed likely holding rates steady until clear evidence indicates inflation’s return to target levels.
Overall, the latest inflation data points to a mixed but persistent inflationary environment in early 2026: while headline CPI has moderated toward multi-year lows, core inflation — especially as captured by PCE — has proven more resilient than expected. This underscores the complexity facing policymakers as they balance inflation control against economic growth.
9. How Inflation Impacts Consumers
Inflation is not an abstract economic concept — it directly affects everyday life. From grocery bills and rent payments to credit card balances and retirement savings, rising prices reshape household financial decisions. Understanding how inflation impacts consumers helps explain shifts in spending behavior, debt levels, and overall economic confidence.
9.1 Cost of Living Increases
The most immediate effect of inflation is a higher cost of living. As prices rise across major categories — housing, food, transportation, healthcare, and utilities — households must allocate more income to maintain the same standard of living.
Key Areas Where Consumers Feel Inflation Most:
- Housing: Rent and mortgage payments represent the largest share of household expenses. Rising shelter costs significantly impact monthly budgets.
- Food: Grocery prices tend to rise steadily during inflationary periods.
- Energy: Gasoline and electricity price swings quickly affect discretionary income.
- Insurance: Auto and health insurance premiums have shown persistent upward pressure in recent years.
Even moderate annual inflation compounds over time. A 3% inflation rate sustained for five years increases prices by more than 15% cumulatively.
9.2 Wage Growth vs Inflation
Wage growth determines whether inflation improves or erodes living standards. If wages rise faster than inflation, real income increases. If inflation outpaces wages, purchasing power declines.
Real Wage Formula:
Real Wage Growth = Nominal Wage Growth − Inflation Rate
For example:
- Nominal wage growth = 4.5%
- Inflation = 3.0%
- Real wage growth = 1.5%
During peak inflation in 2022, inflation exceeded wage growth for several consecutive months, resulting in negative real wages. As inflation moderates, real wages can recover — but only if price growth slows sustainably.
Service-sector wage growth is particularly important because it can reinforce inflation if businesses pass higher labor costs onto consumers.
9.3 Impact on Savings and Retirement
Inflation reduces the purchasing power of savings over time. Cash held in low-interest accounts loses value if the interest earned does not exceed inflation.
Example:
- Savings account interest rate = 1.0%
- Inflation rate = 3.0%
- Real return = −2.0%
For retirees on fixed incomes, inflation poses a significant risk. Social Security payments are adjusted annually for inflation, but healthcare and housing costs may rise faster than the general index.
Long-Term Retirement Impact:
- Higher inflation requires larger retirement portfolios.
- Asset allocation may shift toward inflation-protected securities or equities.
- Fixed-income investments can lose real value during high inflation periods.
Inflation planning is therefore a critical component of long-term financial strategy.
9.4 Credit Card and Mortgage Rates
Inflation often leads to higher interest rates as the Federal Reserve tightens policy. This increases borrowing costs for consumers.
Credit Cards:
- Variable interest rates adjust quickly when the Fed raises rates.
- Higher APRs increase monthly minimum payments.
- Carrying balances becomes more expensive.
Mortgages:
- Fixed mortgage rates reflect long-term interest rate expectations.
- Higher rates reduce affordability and housing demand.
- Monthly payments increase for new buyers.
For households with adjustable-rate debt, sustained high rates significantly raise debt servicing burdens.
9.5 Inflation and Household Budget Example
The table below compares a hypothetical middle-income household budget in 2020 versus 2026, illustrating the compounding effects of inflation.
| Category | 2020 Monthly Cost | 2026 Monthly Cost | Increase |
|---|---|---|---|
| Rent/Mortgage | $1,400 | $1,750 | +25% |
| Groceries | $600 | $760 | +27% |
| Utilities | $200 | $260 | +30% |
| Gasoline | $180 | $230 | +28% |
| Insurance | $250 | $330 | +32% |
| Healthcare | $350 | $430 | +23% |
| Entertainment & Misc. | $300 | $360 | +20% |
| Total | $3,280 | $4,120 | +26% |
This example shows how cumulative inflation significantly increases household expenses over a six-year period. Even if wage growth partially offsets these increases, budgeting becomes more challenging as essential categories absorb a larger share of income.
Ultimately, inflation reshapes consumer behavior — encouraging price comparisons, reduced discretionary spending, increased debt caution, and greater attention to long-term financial planning.
10. How Inflation Impacts Businesses
Inflation does not affect businesses uniformly. While rising prices can increase revenue in nominal terms, they also raise operating costs, alter demand patterns, tighten credit conditions, and compress profit margins. The net effect depends on industry structure, pricing power, cost flexibility, and access to capital. Understanding how inflation reshapes business dynamics helps explain corporate earnings cycles, stock market volatility, and employment trends.
10.1 Input Costs and Profit Margins
Inflation increases the cost of inputs required to produce goods and services. These inputs include raw materials, energy, transportation, labor, rent, and financing.
Key Cost Pressures Businesses Face:
- Raw Materials: Commodity price increases raise production costs.
- Energy: Fuel and electricity affect manufacturing, logistics, and service sectors.
- Labor: Wage growth often accelerates during inflationary periods.
- Borrowing Costs: Higher interest rates increase financing expenses.
If businesses cannot pass these higher costs on to consumers, profit margins shrink.
Profit Margin Formula:
Profit Margin = (Revenue − Costs) ÷ Revenue
For example, if costs rise 10% but revenue increases only 5%, margins compress. This dynamic was visible during peak inflation years when input prices surged faster than final sales prices in certain industries.
10.2 Pricing Power and Demand
Pricing power refers to a company’s ability to raise prices without significantly reducing demand. During inflationary periods, businesses with strong brand loyalty or limited competition can maintain margins more effectively.
Industries with Strong Pricing Power:
- Consumer staples (essential goods)
- Healthcare services
- Utilities
- Technology platforms with a dominant market share
By contrast, businesses in highly competitive markets with price-sensitive customers may struggle to pass on higher costs.
Demand elasticity becomes critical. If consumers reduce spending due to higher prices, revenue growth slows despite inflation. This creates a delicate balance between price increases and maintaining sales volume.
10.3 Small Business vs Large Corporations
Inflation impacts small businesses differently from large corporations.
Small Businesses:
- Limited negotiating power with suppliers
- Less access to low-cost financing
- Higher sensitivity to local economic conditions
- Greater vulnerability to margin compression
Large Corporations:
- Greater pricing power
- Diversified revenue streams
- Stronger balance sheets
- Ability to hedge commodity exposure
During high inflation cycles, large firms often outperform smaller competitors due to scale advantages and access to capital markets.
10.4 Impact on Hiring and Layoffs
Inflation influences labor market decisions in two major ways: wage pressures and monetary tightening.
Wage Pressure:
- Workers demand higher wages to offset rising living costs.
- Labor-intensive industries face higher operating expenses.
- Persistent wage growth can reinforce service-sector inflation.
Monetary Tightening:
- Higher interest rates slow demand.
- Businesses reduce expansion plans.
- Hiring slows, or layoffs increase if revenue declines.
Historically, aggressive rate-hiking cycles aimed at reducing inflation have eventually cooled labor markets. The timing depends on how quickly demand slows relative to wage growth.
10.5 Corporate Earnings vs Inflation Trends
Corporate earnings performance during inflation cycles depends on whether companies can maintain margins.
Early Inflation Phase:
- Revenue rises in nominal terms.
- Profit growth may appear strong initially.
Persistent High Inflation:
- Costs accelerate faster than revenue.
- Margins compress.
- Earnings growth slows.
Disinflation Phase:
- Input costs stabilize.
- Pricing pressure eases.
- Margin recovery begins.
Stock market performance often anticipates these transitions. When investors believe inflation has peaked and margins will recover, equity markets typically respond positively.
Ultimately, inflation reshapes corporate strategy — influencing capital expenditures, pricing decisions, hiring plans, and long-term investment allocation. Businesses that adapt quickly to cost pressures and shifting demand conditions are better positioned to maintain stability during inflationary cycles.
11. Inflation and Asset Markets
Inflation reshapes asset markets through its influence on interest rates, discount rates, liquidity conditions, and investor psychology. Every major asset class — equities, bonds, gold, real estate, and cryptocurrencies — reacts differently depending on whether inflation is moderate, accelerating, peaking, or declining. Understanding these transmission mechanisms allows investors and analysts to interpret market rotations and volatility during inflationary cycles.
11.1 Stock Market Performance During Inflation
Equities respond to inflation through two primary channels: corporate earnings and valuation multiples.
Moderate Inflation (1–3%)
- Supports nominal revenue growth
- Signals healthy demand
- Often correlates with strong equity performance
High Inflation (Above 4–5%)
- Raises interest rates and discount rates
- Compresses valuation multiples
- Increases volatility
- Pressures profit margins if costs rise faster than pricing power
Growth stocks are particularly sensitive because their valuations depend heavily on future earnings discounted at prevailing interest rates. When rates rise sharply during inflationary periods, these valuations decline.
Historically, sectors such as energy, materials, and consumer staples have outperformed during inflation surges, while long-duration growth sectors have underperformed.
11.2 Bonds and Treasury Yields
Fixed-income markets are directly impacted by inflation because bond payments are fixed in nominal terms. When inflation rises, the real value of those payments declines, leading investors to demand higher yields.
Key Bond Market Reactions:
- Higher inflation expectations push Treasury yields upward.
- Bond prices fall as yields rise.
- Long-duration bonds experience larger price declines.
The 10-year Treasury yield is particularly important because it influences mortgage rates, corporate borrowing costs, and global capital flows.
Inflation Expectations & Breakeven Rates
Markets derive expected inflation from the spread between nominal Treasuries and Treasury Inflation-Protected Securities (TIPS). Rising breakeven rates indicate increasing inflation expectations.
11.3 Gold as an Inflation Hedge
Gold is traditionally viewed as a hedge against inflation and currency debasement. It functions as a store of value independent of central bank monetary policy.
Gold Tends to Rise When:
- Real interest rates are negative
- Inflation expectations increase
- Currency purchasing power weakens
- Geopolitical risk increases
However, gold does not always rise with inflation. If inflation is accompanied by sharply rising real interest rates, gold may underperform because investors can earn positive real returns in bonds.
Gold performs best when inflation is elevated, but monetary policy remains accommodative.
11.4 Real Estate and Inflation
Real estate often benefits from moderate inflation because property values and rents tend to increase alongside general price levels.
Positive Inflation Dynamics:
- Rental income rises with inflation
- Replacement costs increase, supporting asset values
- Fixed-rate debt becomes cheaper in real terms
Risks in High Inflation:
- Mortgage rates rise sharply
- Housing affordability declines
- Commercial real estate faces refinancing stress
Real estate performance during inflation depends heavily on financing conditions. If inflation triggers aggressive rate hikes, housing demand can weaken significantly.
11.5 Cryptocurrency and Inflation Narrative
Cryptocurrencies, particularly Bitcoin, are often promoted as “digital gold” and an inflation hedge due to their fixed supply mechanisms. However, their real-world performance during inflation cycles has been more complex.
The Inflation Hedge Argument:
- Limited supply (e.g., Bitcoin capped at 21 million coins)
- Decentralized monetary structure
- Protection against fiat currency expansion
Reality During Recent Inflation Cycles:
- Cryptocurrencies behaved more like high-risk tech assets.
- Prices fell sharply during aggressive rate hikes in 2022.
- Liquidity conditions and risk appetite played larger roles than inflation alone.
Crypto assets tend to perform best when liquidity is abundant and real interest rates are low. During tightening cycles aimed at controlling inflation, speculative assets often experience higher volatility.
The inflation narrative remains influential in cryptocurrency markets, but empirical performance suggests crypto behaves more like a high-beta risk asset than a consistent inflation hedge.
Each asset class responds differently depending on whether inflation is accelerating, stabilizing, or declining. Investors who understand the transmission channels between inflation, interest rates, and asset valuations can better navigate changing macroeconomic conditions.
12. Is Inflation Under Control or Rising Again?
After the historic inflation surge of 2021–2022 and the aggressive monetary tightening that followed, the key economic question in 2026 is no longer whether inflation peaked — it is whether inflation is sustainably under control or at risk of re-accelerating. Inflation rarely moves in a straight line. Instead, it progresses through phases of surge, disinflation, stabilization, and sometimes renewed pressure. Understanding the difference between these phases is essential for interpreting current economic conditions.
12.1 Disinflation vs Deflation
One of the most common misunderstandings in economic reporting is the confusion between disinflation and deflation.
Disinflation
- Inflation is still positive.
- Prices are rising, but at a slower rate.
- Example: Inflation falls from 6% to 3%.
Deflation
- Prices are declining overall.
- Inflation becomes negative.
- Example: Inflation moves from +1% to −1%.
The United States in 2023–2026 has experienced disinflation, not deflation. Prices are still higher than in prior years — they are simply increasing at a slower pace than during the peak surge.
Deflation is typically associated with severe economic downturns and weak demand, whereas disinflation often reflects successful monetary tightening.
12.2 Sticky Inflation Explained
Sticky inflation refers to price increases that are slow to decline, even after temporary factors like energy spikes have faded.
Sticky Components Typically Include:
- Housing (rent and owners’ equivalent rent)
- Services inflation
- Insurance premiums
- Healthcare services
These categories adjust slowly because they are tied to contracts, wage agreements, and structural demand-supply imbalances.
Sticky inflation is particularly important because it reflects underlying economic momentum rather than temporary commodity shocks. Central banks monitor sticky components closely to determine whether inflation pressures are truly easing or merely shifting.
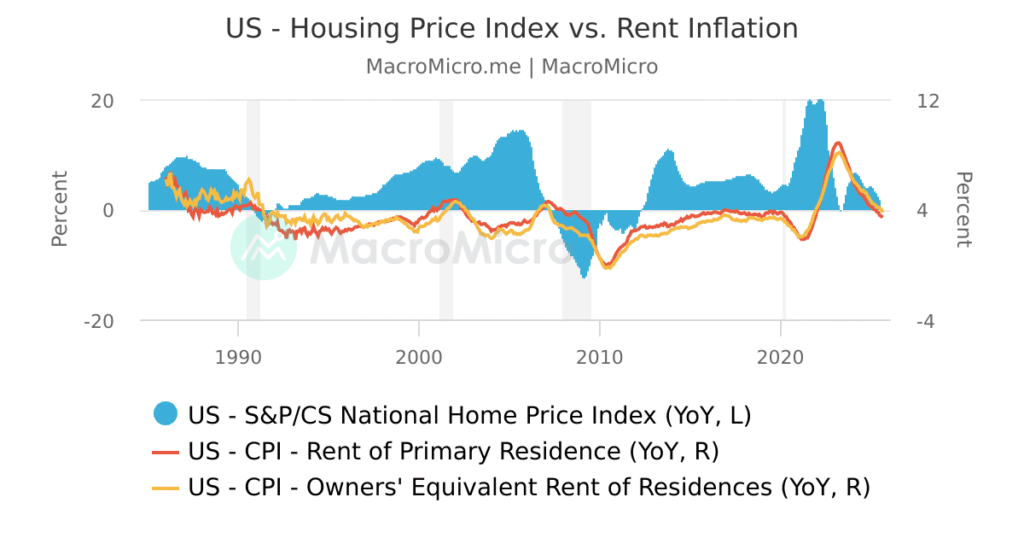
12.3 Housing Inflation Persistence
Housing represents the largest component of CPI, accounting for roughly one-third of the index. As a result, housing inflation has an outsized impact on overall inflation trends.
Why Housing Inflation Persists:
- Long-term rental contracts delay price adjustments.
- Supply shortages in key metropolitan areas.
- High mortgage rates are limiting home construction.
- Demographic demand pressures.
Even when market-based rent indicators show cooling, official CPI shelter data may lag by several months. This lag effect can make inflation appear stickier than real-time market data suggests.
Because housing is both a consumption good and an investment asset, it plays a dual role in inflation dynamics.
12.4 Energy Price Volatility
Energy prices remain one of the most volatile components of inflation. Oil markets are influenced by geopolitical tensions, supply constraints, production decisions, and global demand fluctuations.
Energy’s Impact on Inflation:
- Direct effect through gasoline and utilities.
- Indirect effect through transportation and logistics costs.
- Psychological impact on consumer expectations.
Energy spikes can quickly raise headline inflation, even if core inflation remains stable. Conversely, falling oil prices can accelerate disinflation in the short term.
Because energy markets are globally interconnected, domestic inflation can be influenced by international events.
12.5 Leading Indicators to Watch
To determine whether inflation is under control or at risk of rising again, economists monitor leading indicators that often signal future price trends.
ISM Prices Paid Index
- Measures input cost pressures in manufacturing and services.
- Rising readings suggest upstream price pressure.
- Declining readings signal easing inflation momentum.
Wage Growth Data
- Average hourly earnings
- Employment Cost Index (ECI)
- Labor cost growth trends
Persistent wage growth above productivity gains can sustain service-sector inflation.
Oil Prices
- West Texas Intermediate (WTI) crude benchmarks
- Global supply-demand balance
- Geopolitical developments
Sudden increases in oil prices often lead headline inflation higher within months.
By analyzing these leading indicators alongside CPI and PCE reports, analysts can better assess whether inflation is stabilizing near target levels or beginning another upward cycle.
Inflation rarely disappears abruptly. It either gradually normalizes through sustained policy discipline or re-emerges when economic conditions shift. The coming months will reveal whether the disinflation phase matures into stable price growth or transitions into renewed pressure.
13. Frequently Asked Questions About U.S. Inflation
This section addresses the most common questions Americans are asking about inflation in 2026. These answers are structured clearly and directly to provide both economic depth and practical clarity.
Is inflation going up in 2026?
Inflation in 2026 is no longer at the extreme highs seen in 2022, but it has not fully returned to the Federal Reserve’s 2% target either. Instead, inflation appears to be in a stabilization phase.
Recent data show that headline inflation has moderated significantly from peak levels. However, certain components — particularly housing and services — remain elevated. This creates a mixed environment where inflation is lower than during the surge but still somewhat above long-term price stability goals.
The key question for 2026 is not whether inflation is surging again, but whether it can sustainably move closer to 2% without triggering a recession. That answer depends largely on wage growth, housing trends, and global energy prices.
What is the current core inflation rate?
Core inflation — which excludes food and energy — is currently running modestly above the Federal Reserve’s 2% target. Core measures tend to move more slowly than headline inflation because they reflect persistent categories like housing, healthcare, and services.
Core inflation is especially important because it signals whether underlying price pressures are easing or remaining sticky. Even when energy prices decline and bring headline inflation lower, elevated core readings can indicate that inflation has not fully normalized.
Investors and policymakers closely monitor core PCE inflation, as it is the Fed’s preferred benchmark.
Why does the Fed prefer PCE?
The Federal Reserve prefers the Personal Consumption Expenditures (PCE) price index for three primary reasons:
- Broader Coverage: PCE includes a wider range of consumer expenditures, including healthcare spending paid by employers and government programs.
- Dynamic Weighting: It adjusts more quickly to changes in consumer behavior.
- Substitution Effects: PCE accounts more effectively for consumers switching to lower-cost alternatives when prices rise.
Because of these structural differences, PCE typically runs slightly lower than CPI and is viewed by policymakers as a more comprehensive measure of underlying inflation trends.
When will interest rates go down?
Interest rate decisions depend primarily on the trajectory of inflation and labor market conditions. If inflation continues to move sustainably toward 2% and economic growth moderates, the Federal Reserve may gradually reduce rates.
However, rate cuts are unlikely if core inflation remains sticky or if inflation expectations begin rising again. Policymakers typically require several months of consistent disinflation before shifting toward easing policy.
In short, rate cuts are possible — but they depend on confirmed progress in inflation data rather than short-term fluctuations.
Is 2% inflation realistic?
The Federal Reserve’s long-term target of 2% inflation is designed to balance price stability with economic growth. Moderate inflation provides flexibility for wage adjustments and supports steady expansion.
Historically, the United States maintained inflation near or below 2% for much of the 2010–2019 period. However, achieving 2% again after a major inflation surge can be challenging because:
- Housing supply remains constrained.
- Labor markets remain tight in some sectors.
- Global supply chains have structurally shifted.
- Geopolitical risks affect energy markets.
While 2% inflation is realistic over the long term, reaching and sustaining that level requires stable wage growth, disciplined monetary policy, and balanced supply-demand conditions across the economy.
Inflation is not a single number — it is a dynamic process influenced by labor markets, global trade, energy prices, and monetary policy.
14. Final Analysis: What U.S. Inflation Trends Mean for the Economy Ahead
After examining CPI trends, PCE data, interest rate policy, asset market reactions, and consumer impacts, the central question remains: what do current inflation dynamics mean for the U.S. economy going forward?
Inflation is no longer at crisis levels, but it has not fully returned to long-term stability either. The economy now sits in a delicate transition phase — balancing disinflation progress against structural pressures that could slow the final move toward the Federal Reserve’s 2% target.
14.1 Short-Term Outlook (Next 6 Months)
In the short term, inflation is likely to remain moderate but uneven. Headline inflation may fluctuate due to energy price movements, while core inflation — especially housing and services — will determine the broader trend.
Key Short-Term Drivers:
- Monthly shelter inflation data
- Wage growth momentum
- Energy price volatility
- Consumer spending resilience
If inflation continues gradually ease and wage growth stabilizes, the Federal Reserve may consider cautious policy adjustments. However, any re-acceleration in services inflation could delay rate reductions.
The next six months will largely determine whether disinflation transitions into stable normalization or stalls above target levels.
14.2 Medium-Term Outlook (1–2 Years)
Over the next one to two years, inflation trends will depend on the interaction between labor markets, productivity growth, and global supply conditions.
Potential Medium-Term Scenarios:
- Soft Landing: Inflation gradually returns to 2% without triggering a recession.
- Sticky Inflation Plateau: Inflation stabilizes around 2.5–3%, requiring prolonged higher interest rates.
- Re-acceleration Risk: Supply shocks or wage pressures push inflation higher again.
The most difficult phase of disinflation historically is the final move toward the target. The economy may experience slower growth during this adjustment, as restrictive monetary policy continues to weigh on demand.
14.3 Long-Term Structural Inflation Risks
Even if inflation moderates in the short term, several long-term structural factors could influence price stability over the next decade.
Structural Risks Include:
- Housing Supply Constraints: Persistent shortages in major metro areas.
- Demographic Shifts: Aging population and labor participation trends.
- Geopolitical Fragmentation: Trade realignment and supply chain restructuring.
- Fiscal Policy Pressures: Expanding public debt and long-term deficits.
- Climate and Energy Transition Costs: Infrastructure and production adjustments.
Unlike temporary energy spikes, structural inflation drivers require sustained productivity growth and policy coordination to be managed effectively.
14.4 What Households, Investors, and Businesses Should Monitor
Inflation monitoring is no longer limited to policymakers. Households, investors, and businesses all benefit from understanding early signals of price shifts.
For Households:
- Real wage growth trends
- Mortgage rate movements
- Rent and housing data
For Investors:
- Core PCE inflation releases
- Federal Reserve rate guidance
- 10-year Treasury yields
- Corporate earnings margins
For Businesses:
- Input cost indexes (ISM prices paid)
- Labor cost growth
- Consumer demand strength
- Financing conditions
Inflation shapes economic expectations, investment decisions, and strategic planning. Whether inflation settles sustainably near 2% or remains structurally higher will determine interest rate paths, asset valuations, and long-term growth potential.
The U.S. economy has moved beyond the acute phase of the inflation surge, but the final stage — achieving durable price stability — remains the defining macroeconomic challenge ahead.
Conclusion: Understanding U.S. Inflation in a Changing Economic Era
Inflation is not simply a monthly statistic — it is the central force shaping the modern U.S. economic landscape. From CPI and PCE calculations to Federal Reserve rate decisions, from household budgets to corporate profit margins, inflation influences nearly every financial decision made in the economy.
The post-2021 inflation surge reminded Americans how quickly price stability can shift. While inflation has moderated from peak levels, it has not fully returned to long-term equilibrium. The final stage of disinflation — moving sustainably toward the Federal Reserve’s 2% target — is historically the most challenging phase.
The path forward depends on several key forces: wage growth, housing supply, energy markets, productivity trends, and disciplined monetary policy. Short-term volatility may continue, but long-term price stability requires balanced demand, sustainable fiscal policy, and stable global supply conditions.
For households, understanding inflation means protecting purchasing power and planning intelligently. For investors, it means interpreting rate cycles and asset sensitivity correctly. For businesses, it means managing margins, pricing strategies, and capital allocation with precision.
Inflation is not disappearing — it is evolving. The most important skill is not reacting emotionally to headlines, but understanding the data behind them.
As the U.S. economy moves through its next cycle, those who understand inflation trends — not just the numbers, but the mechanisms driving them — will be better positioned to navigate uncertainty, manage risk, and make informed financial decisions.
Subscribe to trusted news sites like USnewsSphere.com for continuous updates.