

U.S. Housing Market Is Creating a Longer Road to Break Even
U.S. housing market conditions in 2026 are creating a problem that is easy to miss when looking only at the price of a house: buying a home can require years of ownership before appreciation and equity growth overcome the full cost of getting in, financing the property, maintaining it and eventually selling it.
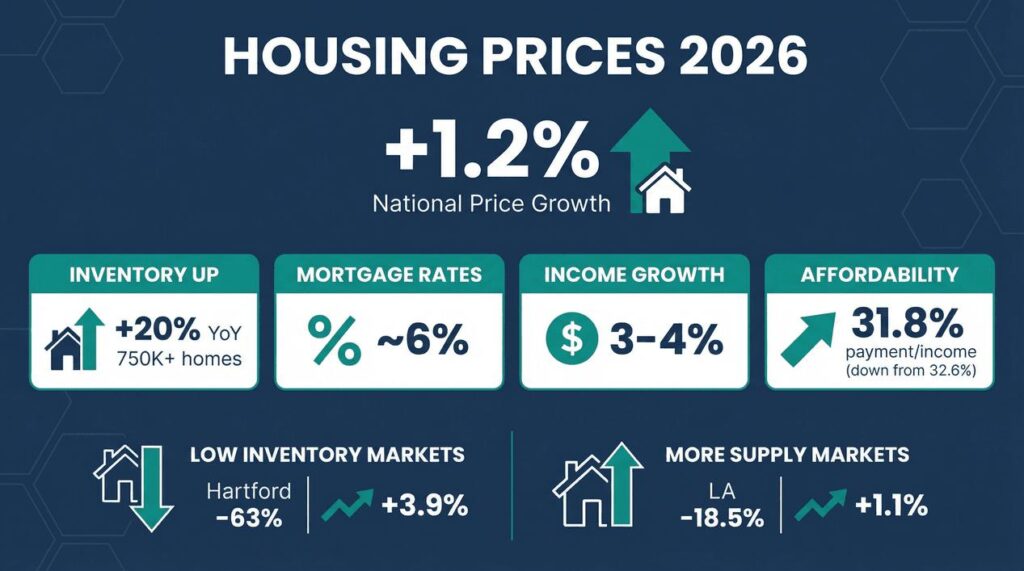
The latest numbers show why. Zillow reported that the typical U.S. home value was $371,774 as of July 31, 2026, up just 1% over the previous year, while its one-year national forecast was about 1.1%. At the same time, Redfin’s July Home Price Index showed prices rising 3.4% year over year, illustrating an important point: different housing datasets measure different parts of the market, so buyers should not treat one national number as the definitive answer for every city.
Mortgage rates are also keeping the cost of ownership elevated. Freddie Mac reported that the average 30-year fixed mortgage rate was 6.65% on August 20, 2026, compared with 6.58% a year earlier. Rates had briefly moved lower during the summer before climbing again, leaving buyers with much higher financing costs than during the ultra-low-rate period of the pandemic.
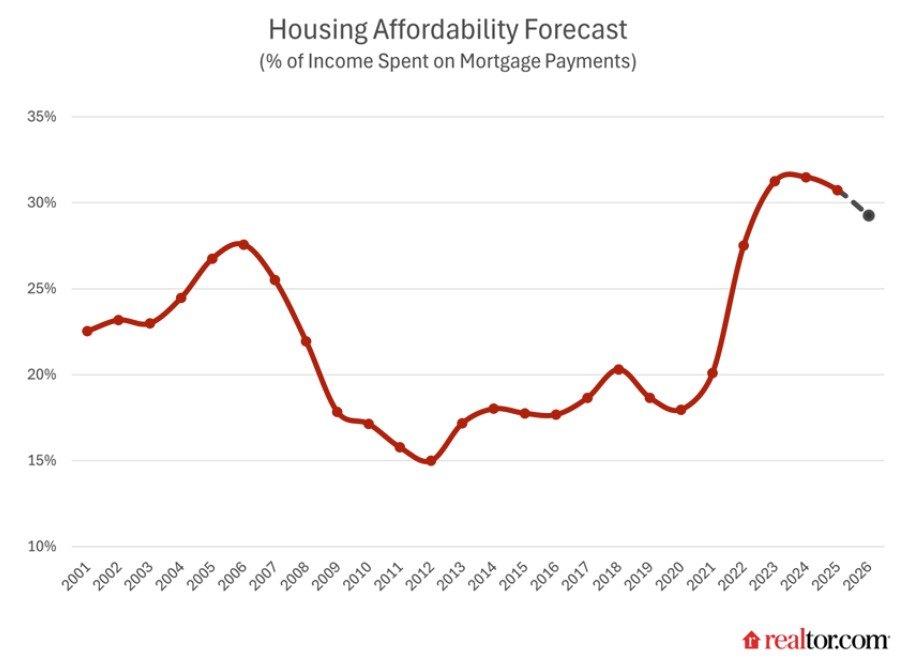
That combination creates the new housing problem: a home can appreciate while still being a poor short-term financial investment for its owner. Appreciation alone is not the same thing as profit. Buyers also have to overcome mortgage interest, property taxes, insurance, maintenance, upfront closing expenses and the costs associated with selling.
Recent housing research has made the same point from another direction. Realtor.com reported that under a slower-appreciation scenario, national break-even timelines can stretch dramatically, while regional differences can be enormous.
The Real Cost of a $400,000 Home in 2026
Consider a simplified example of a buyer purchasing a $400,000 home with a 20% down payment. The buyer would put down $80,000 and finance approximately $320,000.
At a 6.65% 30-year fixed mortgage rate, the principal-and-interest payment on a $320,000 loan is roughly $2,054 per month. That is about $24,651 per year before property taxes, homeowners insurance, maintenance, HOA fees or utilities.
The table below illustrates why the purchase price is only the beginning of the calculation.
| Cost | Illustrative assumption | Approximate amount |
|---|---|---|
| Home price | $400,000 | $400,000 |
| Down payment | 20% | $80,000 |
| Mortgage | 80% | $320,000 |
| Mortgage rate | 30-year fixed | 6.65% |
| Principal + interest | Monthly | ~$2,054 |
| Principal + interest | Annual | ~$24,651 |
| Property tax | 1.1% example | ~$4,400/year |
| Home insurance | 0.35% example | ~$1,400/year |
| Maintenance | 1% example | ~$4,000/year |
| Illustrative purchase closing costs | 3% example | ~$12,000 |
| Illustrative selling costs | 6% example | ~$24,000 on a $400,000 sale |
The tax, insurance, maintenance and transaction-cost assumptions above are illustrative rather than national averages. Actual expenses vary substantially by state, county, property type, insurance market, HOA and financing arrangement.
The Consumer Financial Protection Bureau says buyers should generally expect closing costs of about 2% to 5% of the purchase price, excluding the down payment. Those costs can include lender charges, appraisal expenses, title-related costs, government fees, prepaid taxes and insurance.
That matters because a buyer who thinks, “I only need $80,000 for the down payment,” may actually need considerably more cash to complete the transaction and establish a financial cushion.
The other side of the equation is the mortgage. At 6.65%, the first years of a 30-year loan are heavily weighted toward interest rather than principal repayment. The homeowner is building equity, but the equity accumulation is not necessarily fast enough to offset every other ownership expense.
This is why a house can rise in value and still fail to produce a meaningful financial gain after a short holding period.
Why Home Appreciation May Not Be Enough
The biggest misconception in homeownership math is that a $400,000 house that becomes a $420,000 house has automatically generated a $20,000 profit.
It has not.
Suppose the home rises 5% in value over one year. A $400,000 property would become approximately $420,000. But the owner still has mortgage interest, property taxes, insurance, maintenance and the original transaction costs. If the owner sells, selling expenses can reduce the amount of money received from the transaction.
Even more importantly, the homeowner still has to pay off the remaining mortgage balance.
This is why home appreciation and homeowner profit are two different measurements.
A buyer needs sufficient appreciation to overcome the frictional costs surrounding real estate. And unlike a stock that can generally be sold with a relatively small transaction cost, moving in and out of residential property can involve substantial expenses.
The tax treatment can also matter. The IRS says qualifying homeowners may generally exclude up to $250,000 of gain on the sale of a main home, or up to $500,000 for married taxpayers filing jointly, subject to the applicable eligibility requirements. That can significantly change the after-tax economics for some long-term homeowners, although it does not eliminate mortgage, maintenance or transaction costs.
Illustrative break-even stress test
Using the $400,000 example, a 20% down payment, a $320,000 mortgage at 6.65%, illustrative property taxes and insurance, maintenance equal to 1% of the home’s value annually, 3% purchase closing costs and 6% selling costs, the ownership math changes dramatically depending on appreciation.
| Annual home appreciation | General implication |
|---|---|
| 1% | Very difficult to overcome ownership and transaction costs quickly |
| 2% | Break-even can remain distant |
| 3% | Long holding period may still be required |
| 4% | Economics improve, but short-term selling can remain unattractive |
| 5% | Stronger appreciation materially improves the outlook |
| 6% | Break-even becomes considerably more achievable |
These are scenario calculations, not forecasts. They demonstrate sensitivity to appreciation rather than predicting what a particular home will be worth.
For example, in a model using 6% annual appreciation and the assumptions above, the cumulative economics can remain negative for many years before eventually turning positive. That illustrates just how powerful the combination of mortgage interest and recurring ownership costs can be.
The opposite is also true: if a buyer purchases in a market where prices appreciate substantially faster than expected, the break-even period can shrink.
The lesson is simple: the purchase price is only one number in the homeownership equation.
What This Means for You
For buyers, the most important question in 2026 may not be “Will home prices fall?” It may be “How long am I realistically willing and able to own this home?”
That question becomes especially important for anyone who expects to move for work, relocate to another state, upgrade to a larger property, change family circumstances or sell within a few years.
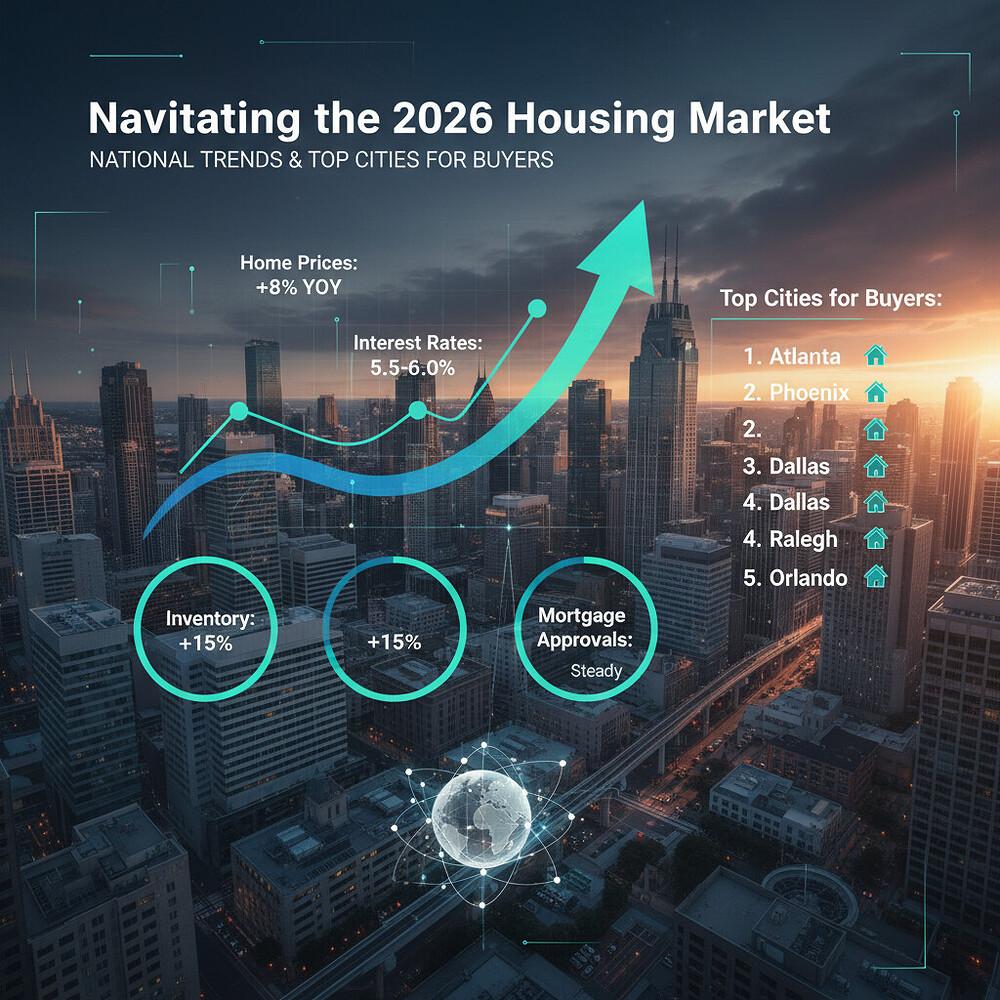
National data shows that the housing market is not moving in one direction everywhere. NAR reported that June existing-home sales fell 2.4% month over month to a seasonally adjusted annual rate of 4.09 million, while the median existing-home price reached $440,600, up 1.8% year over year, with 4.6 months of inventory.
Redfin’s data painted a somewhat different picture, with its June median sale price at $408,776, up 2.2% year over year, and July home prices up 3.4% year over year on its Home Price Index. The differences highlight why buyers should investigate the specific market and property type rather than relying on one national headline.
There is also some good news for buyers. Redfin reported in late July that there were hundreds of thousands more sellers than buyers nationally, giving buyers in many markets more time to shop and negotiate. Pending sales, however, were weakening as mortgage rates moved higher.
That combination can create opportunities for disciplined buyers.
A buyer who negotiates the purchase price down, secures a lower mortgage rate, obtains seller concessions, avoids unnecessary upgrades and chooses a property with manageable taxes and insurance can improve the break-even calculation considerably.
The reverse is also true. Paying a premium for a house in a slow-growth market can make the ownership equation much harder.
Investor takeaway: Real estate investors should be even more careful. A property that looks attractive because its nominal value is rising may still deliver a weak return after financing costs, taxes, insurance, repairs, vacancy, management expenses and selling costs. Investors should focus on cash flow, net operating income, financing terms and expected exit value rather than simply assuming home prices will continue rising.
For homeowners, the calculation is different because housing also provides a place to live. A homeowner should not treat every dollar spent on housing as an investment loss. Part of the expense is paying for shelter, stability, control over the property and the ability to build equity.
That is why a pure investment calculation can never fully answer the rent-versus-buy question for every household.
Future Outlook: The Five-Year Rule Is Getting Harder to Trust
The old idea that homeowners should simply buy a house, wait five years and automatically come out ahead is becoming less reliable.
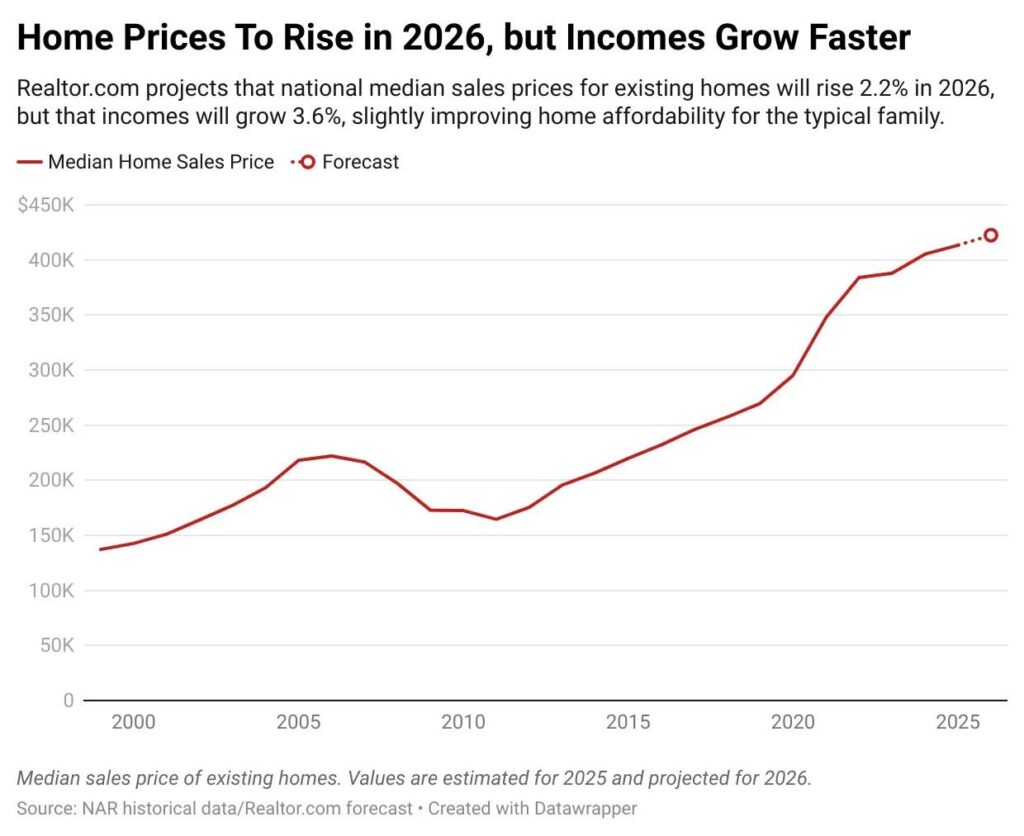
Recent research illustrates why. Realtor.com previously estimated that buyers entering the 2026 market could need roughly a decade or more to recover costs under certain appreciation and transaction-cost assumptions. Its more recent analysis showed an even wider regional range when slower appreciation and carrying costs were considered.
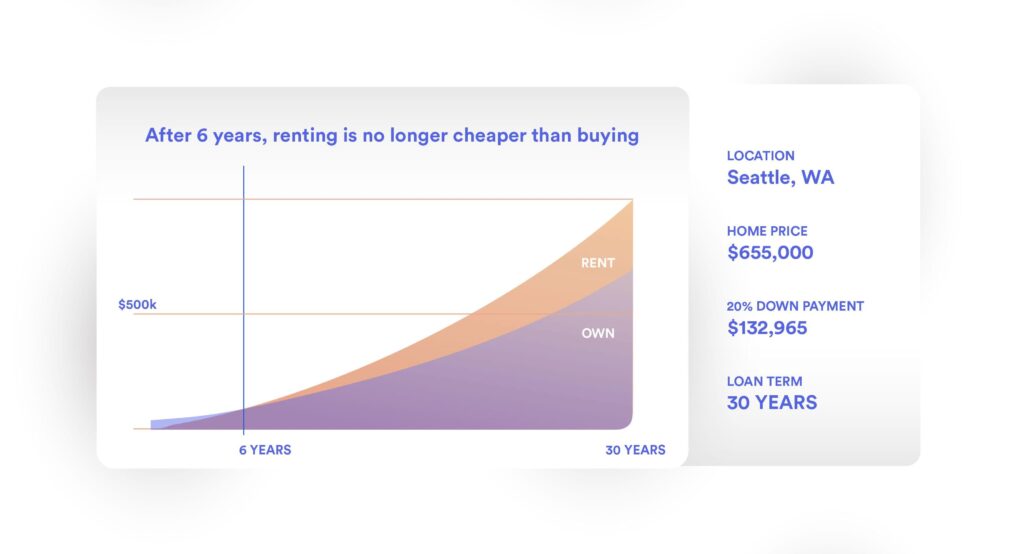
At the same time, other Zillow-related analyses show that the answer changes substantially when the calculation compares buying with renting rather than simply measuring the recovery of ownership expenses. A June 2026 Zillow analysis reported that the typical U.S. buyer could reach a rent-versus-buy break-even point in roughly six years, although some expensive markets had dramatically longer timelines.
A newer Zillow analysis reported in August went further by separating the time required to save a down payment from the subsequent period needed for ownership to become financially advantageous relative to renting. It estimated a national combined timeline of 14.7 years for a median-income household saving 10% of income, including approximately 8.5 years to save a 20% down payment and another 6.2 years to reach the ownership break-even point.
Those numbers are not contradictory. They answer different questions.
One calculation asks: How long until buying beats renting?
Another asks: How long until the home purchase has recovered the full economic cost of ownership?
Another may focus on: How long until the homeowner’s equity exceeds the money invested?
Buyers should know which definition of “break even” is being used before drawing conclusions.
The regional differences could become even more important in the months ahead. Zillow’s July data showed a typical U.S. home value of $371,774, but national averages conceal major differences between expensive coastal markets, the Midwest, the South and individual metropolitan areas.
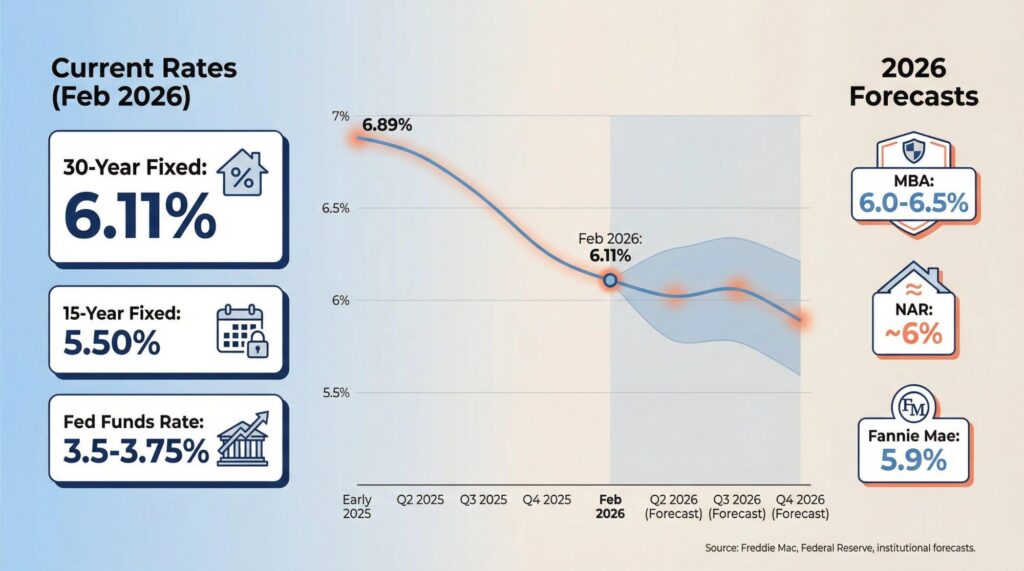
Mortgage rates will remain one of the most important variables to watch. Freddie Mac’s August 20 reading of 6.65% is far below the worst mortgage rates of earlier decades, but it is still high enough to materially affect purchasing power compared with the ultra-low rates that many existing homeowners locked in during the pandemic.
The housing market therefore may not need a dramatic crash to create financial pressure for buyers. A long period of modest appreciation combined with elevated mortgage rates and rising ownership costs can produce its own affordability problem.
For prospective buyers, the smartest approach is not necessarily to wait for a crash or rush into a purchase.
Instead, calculate the numbers for the specific home.
Estimate the mortgage payment. Add taxes. Add insurance. Budget for maintenance. Include closing costs. Estimate the likely selling costs. Then test the result against several appreciation scenarios—such as 1%, 3%, 5% and 7%—and ask how long you would need to stay before the financial picture improves.
That approach is far more useful than relying on a simple five-year rule.
Bottom line: The U.S. housing market in 2026 is not simply a story about whether home prices are rising or falling. It is increasingly a story about time. A buyer may purchase a home today, watch its value rise and still need many years before the appreciation and equity growth meaningfully overcome the complete cost of ownership. In strong markets, that period can be relatively short. In expensive or slow-growing markets, it can stretch for a decade, two decades or substantially longer.
The real question for today’s buyer is therefore not just “Can I afford the mortgage?” It is “Can I comfortably own this home long enough for the numbers to work?”
For the latest housing-market data, readers can follow Zillow’s U.S. housing market data, Redfin’s U.S. housing market data, Freddie Mac’s mortgage-rate data, and NAR’s existing-home sales statistics.
A recent Realtor.com housing-market video and outlook also provides useful context on affordability and the rent-versus-buy gap.
Subscribe to trusted news sites like USnewsSphere.com for continuous updates.