


How to Read a Company’s Earnings Report: 12 Numbers Every U.S. Stock Investor Should Check
How to read an earnings report is one of the most important skills a stock investor can develop. A company’s earnings release may contain dozens of financial figures, tables and management comments, but investors do not need to understand every number before they can make sense of what happened.
The key is knowing which numbers matter, why they matter and how they connect.
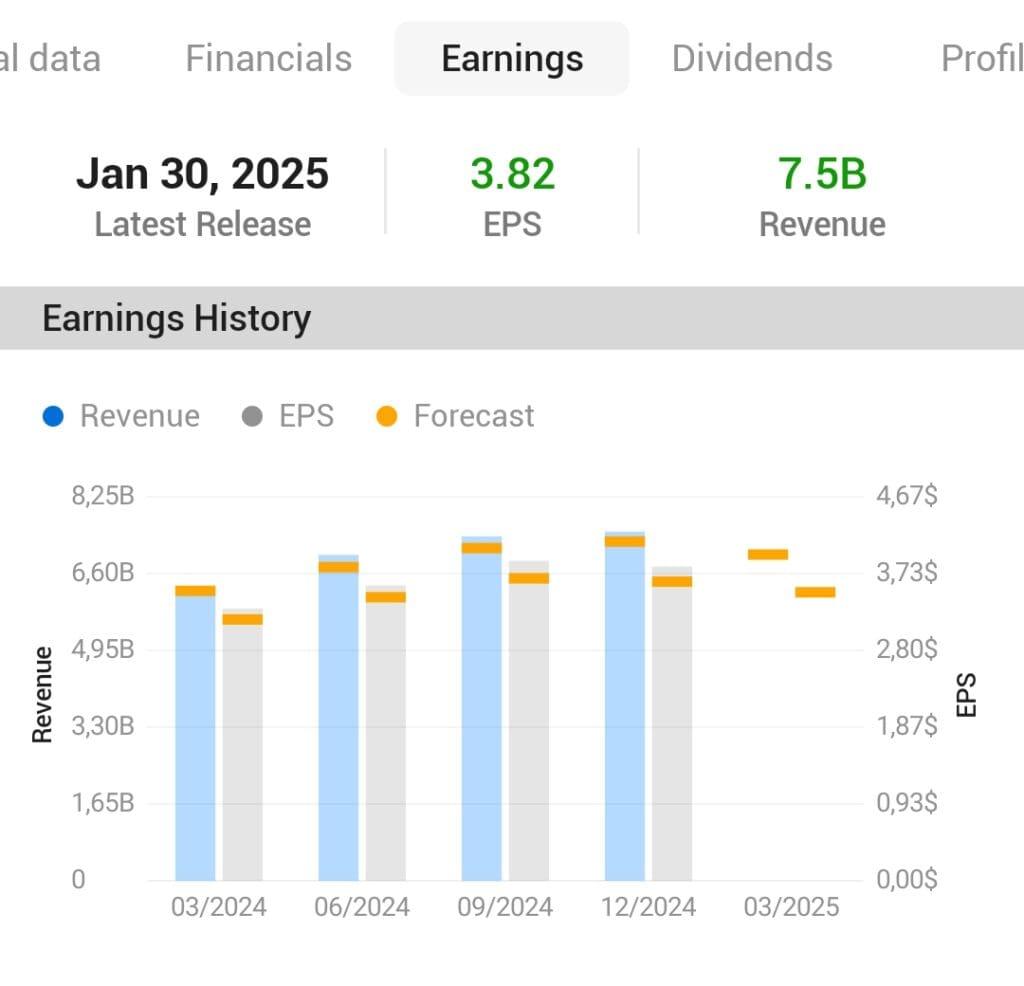
Revenue tells you how much business the company generated. Revenue growth tells you whether that business is expanding. Earnings per share shows how much profit is attributable to each share. Margins reveal whether the company is becoming more or less efficient. Free cash flow shows whether accounting profits are translating into cash. The balance sheet tells you whether the company has enough financial strength to survive and invest.
Then come the forward-looking numbers: guidance, backlog and capital expenditures.
Finally, there is valuation—the number that answers a completely different question: How much are investors paying for all of this performance?
The Securities and Exchange Commission explains that financial statements work together: the income statement shows performance, the balance sheet shows assets and liabilities at a point in time, and the cash-flow statement shows how cash moves through the business. No single statement tells the entire story.
That is the framework investors should use when reading quarterly results.
Start With Revenue and Revenue Growth
Revenue is the natural starting point because it tells you how much money a company generated from selling its products or services during the reporting period.
But the absolute number alone is rarely enough.
A company reporting $10 billion of quarterly revenue may look impressive until you discover that revenue was flat or declining. Another company generating $2 billion may be much more interesting if sales increased 80% from the previous year and management expects another acceleration.

That is why investors should immediately calculate or locate year-over-year revenue growth.
For example:
Revenue growth = (Current revenue − Previous comparable revenue) ÷ Previous comparable revenue × 100
Comparing with the same quarter a year earlier is often useful because it reduces the distortion caused by seasonal business patterns.
Investors should also look at sequential growth—how revenue changed from the immediately preceding quarter—but should be careful with businesses that have strong seasonality.
What should you ask?
When reading revenue, ask:
- Is revenue growing?
- Is growth accelerating or slowing?
- Is growth organic or driven by acquisitions?
- Which business segment is responsible?
- Is growth coming from higher prices, more customers or greater volume?
- Is management’s future revenue outlook improving?
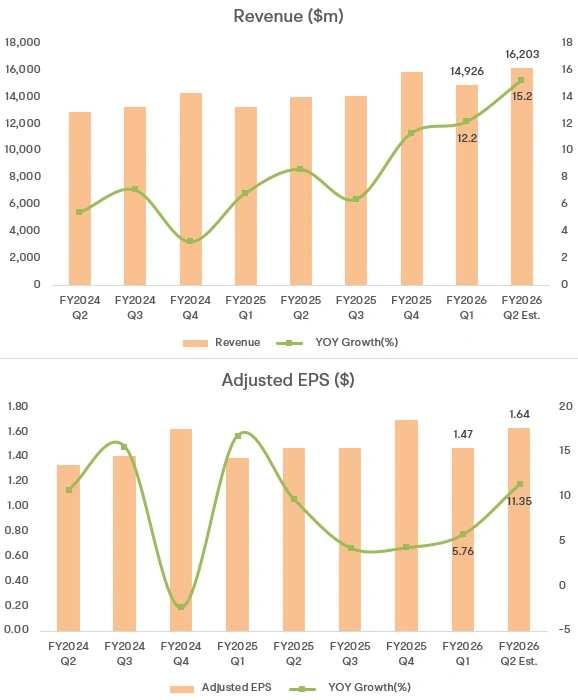
The quality of growth matters as much as the percentage.
A company can increase revenue rapidly while simultaneously losing money or consuming enormous amounts of cash.
That brings us to the next number.
EPS and the Profitability Picture
Earnings per share, or EPS, tells investors how much net income is attributable to each share. The SEC explains that EPS is generally calculated by dividing net income by the number of outstanding shares.
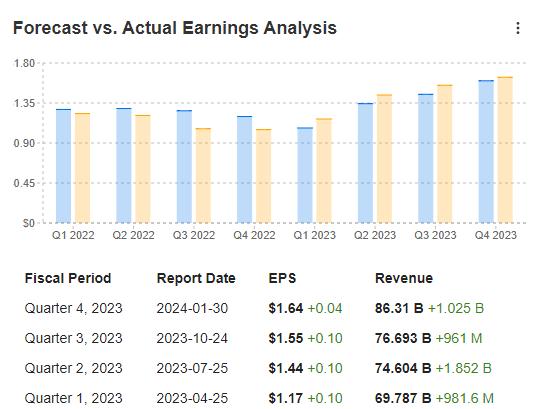
EPS is one of the most closely watched figures during earnings season because Wall Street analysts publish estimates for it and investors compare the reported number with expectations.
But there is an important trap: a company can beat EPS estimates without having a fundamentally stronger business.
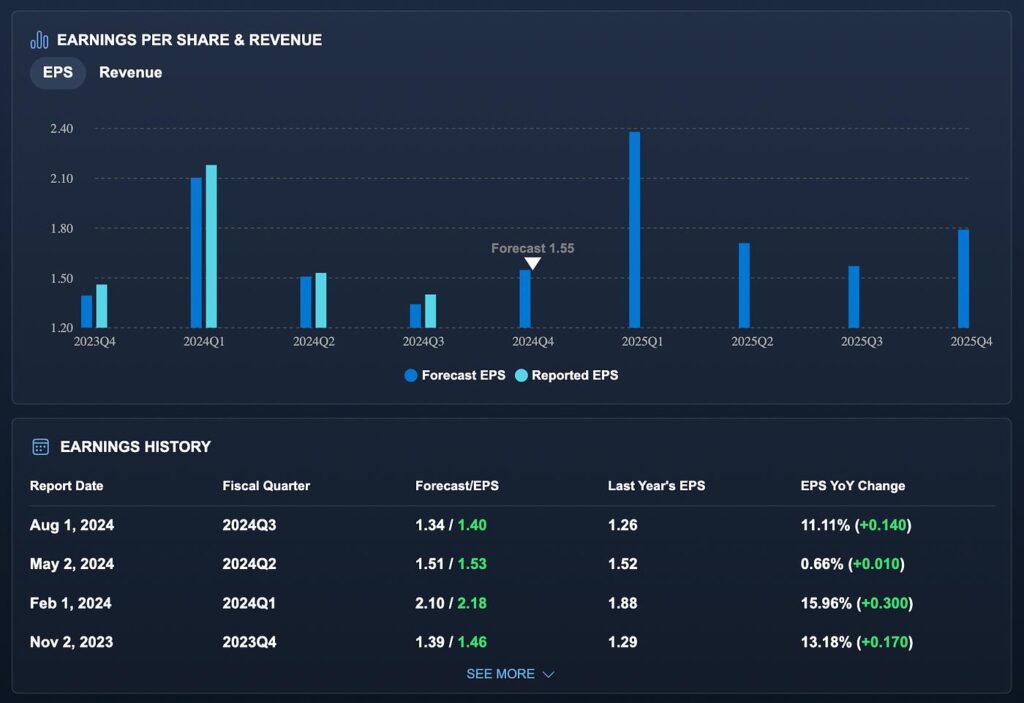
EPS can be influenced by share repurchases, tax benefits, interest income, restructuring charges and other factors.
For that reason, investors should examine both GAAP EPS and adjusted or non-GAAP EPS when a company reports both. GAAP is the standardized accounting framework, while adjusted figures may exclude certain items management considers unusual or non-recurring.
That does not make adjusted EPS useless. It means investors should understand what was excluded.
The next question is whether the company is making money efficiently.
Gross margin
Gross margin measures how much revenue remains after the direct costs associated with producing goods or delivering services.
Gross margin = (Revenue − Cost of revenue) ÷ Revenue
If a company generates $100 of revenue and spends $60 on the direct cost of producing that revenue, its gross margin is 40%.
A rising gross margin can indicate stronger pricing, improved product mix, lower unit costs or better operating efficiency.
A falling margin can indicate competitive pricing pressure, higher input costs, unfavorable product mix or aggressive expansion into lower-margin markets.
For technology and AI companies, gross margin can be particularly important because explosive revenue growth does not automatically translate into attractive economics.
Operating Margin Shows What Happens After Gross Profit
After gross profit, companies still have to pay expenses such as research and development, sales and marketing, general and administrative costs and other operating expenses.
That is where operating margin becomes useful.
Operating margin = Operating income ÷ Revenue
The SEC’s investor guidance describes operating margin as the percentage of each dollar of revenue that becomes operating profit.
Imagine two companies each producing $10 billion in revenue.
Company A has a 25% operating margin.
Company B has a 5% operating margin.
Both have the same revenue, but their businesses have very different economics.
For investors, the trend is often more important than the single-quarter figure.
If revenue grows 30% while operating margin rises from 10% to 15%, the company may be demonstrating significant operating leverage.
But if revenue grows 30% and operating margin falls from 15% to 5%, investors need to understand why.
High growth can require heavy investment, and some companies deliberately sacrifice current margins to build future capacity.
The important question is whether management can eventually convert that investment into sustainable profitability.
Free Cash Flow: The Number Investors Should Not Ignore
One of the biggest mistakes new investors make is assuming that net income and cash generation are the same thing.
They are not.
A company can report accounting profit while consuming significant amounts of cash.
That is why investors should examine free cash flow, commonly calculated as operating cash flow minus capital expenditures.
Free cash flow = Operating cash flow − Capital expenditures
The SEC explains that the cash-flow statement tracks cash entering and leaving the business and separates operating, investing and financing activities.
Free cash flow can provide useful information about how much cash remains after the company spends on the property, equipment and infrastructure needed to operate and grow.
But even here, context matters.
A company building dozens of data centers may have enormous capital expenditures today because management expects much larger revenue tomorrow.
Oracle provides an excellent current example. In fiscal 2026, Oracle generated $32.0 billion of operating cash flow, but free cash flow was negative $23.7 billion as the company invested heavily to expand its cloud infrastructure.
That does not automatically mean Oracle’s business is weak.
It means investors need to ask a deeper question:
Are today’s enormous investments likely to generate sufficient future returns?
Cash and Debt Reveal Financial Strength
After examining profitability and cash flow, move to the balance sheet.
Cash tells you how much liquidity the company has available.
Debt tells you how much it owes and, importantly, how much financing pressure it may face.
The SEC describes the balance sheet as a snapshot of a company’s assets, liabilities and shareholders’ equity at a specific point in time.
Investors should look at:
- Cash and cash equivalents
- Short-term investments
- Total debt
- Current liabilities
- Long-term debt
- Interest expense
- Debt maturities
A company with $10 billion in cash and $2 billion in debt has a very different financial profile from one with $2 billion in cash and $10 billion in debt.
But debt is not automatically bad.
Companies sometimes borrow heavily because they have attractive investment opportunities.
The real issue is whether cash generation and future earnings are sufficient to service that debt without putting the business under excessive financial pressure.
CoreWeave is a useful current case study because its AI infrastructure expansion requires enormous capital investment and financing. In its second-quarter 2026 results, the company reported approximately $2.575 billion in revenue, a $104 billion-plus revenue backlog, and roughly $640 million in net interest expense for the quarter.
For an investor, that combination immediately raises two separate questions:
How powerful is the demand?
And:
How expensive is it to build the capacity required to satisfy that demand?
Both matter.
Guidance Can Matter More Than the Quarter That Just Ended
An earnings report tells you what happened.
Guidance tells you what management expects to happen next.
That distinction is crucial.
Suppose a company reports excellent quarterly results but lowers its full-year revenue outlook. The stock could fall even after a large EPS beat because investors care about future earnings.
The opposite can also happen.
A company might report an imperfect quarter but issue strong guidance, causing investors to focus on improving future performance.
When reading guidance, examine:
- Revenue expectations
- EPS expectations
- Margin expectations
- Full-year outlook
- Next-quarter outlook
- Capital-expenditure plans
- Expected customer demand
Then compare the new guidance with the previous guidance.
A current example: Super Micro
Super Micro Computer’s recent results demonstrate why investors should read guidance alongside the reported quarter.
The company reported fiscal Q4 2026 revenue of approximately $11.12 billion, below the roughly $11.55 billion analyst expectation reported by Reuters. Yet gross margin came in around 17.5%, and management’s fiscal 2027 revenue outlook was $65 billion to $72 billion, well above the average Wall Street estimate cited by Reuters.
That combination illustrates why a single “beat” or “miss” headline can be misleading.
The investor needs to understand what happened, why it happened and what management expects next.
Backlog Can Show Future Demand—but It Is Not Revenue
Backlog is particularly important for companies that operate with large contracts or long implementation periods.
It represents business that has been contracted or otherwise committed but has not yet been recognized as revenue under the company’s accounting rules.
A large backlog can give investors greater visibility into future revenue.
But there is an important warning:
Backlog is not the same as cash in the bank.
Contracts can have delivery schedules, conditions, cancellations, financing requirements or other factors that influence when revenue is recognized.
CoreWeave is an excellent example.
The company reported a revenue backlog of approximately $104 billion in its second-quarter 2026 results, up sharply from the previous year. It also announced more than $25 billion in additional customer commitments early in the following quarter.
That is a remarkable demand signal.
But investors still need to compare the backlog with the company’s ability to build the infrastructure necessary to deliver those contracts.
A $100 billion backlog means something very different for a company that can fulfill contracts efficiently than for a company that must spend tens of billions of dollars on infrastructure before recognizing the associated revenue.
Capital Expenditures Tell You How Expensive Growth Will Be
Capital expenditures, or CapEx, represent spending on long-lived assets such as data centers, factories, equipment and other infrastructure.
For capital-intensive companies, CapEx can be one of the most important numbers in the entire earnings report.
High CapEx can be positive if it creates productive assets that generate attractive future returns.
But high CapEx can also become a problem if revenue fails to grow fast enough to justify the spending.
CoreWeave’s business demonstrates the issue particularly well. Its rapid AI infrastructure expansion requires enormous investment, making CapEx and financing costs critical numbers alongside revenue and backlog. Current reports put second-quarter CapEx at roughly $9.4 billion, with the company raising its full-year 2026 CapEx outlook to approximately $35 billion to $39 billion.
Oracle faces a similar capital-intensity question on a larger corporate scale. Its fiscal 2026 results showed negative free cash flow despite strong operating cash flow because the company was investing heavily in cloud infrastructure.
The investor question is therefore not:
“Is CapEx high?”
It is:
“What return can the company earn on that investment?”
Valuation Is Where the Stock Price Enters the Equation
The first 11 numbers primarily tell you about the business.
Valuation tells you what the market is already paying for that business.
A fantastic company can be a poor investment if the stock price already assumes years of exceptional growth.
A slower-growing company can sometimes be attractive if the market price is substantially below what its future cash flows may justify.
Common valuation measures include:
P/E ratio: Price per share ÷ EPS
Price-to-sales: Market value ÷ Revenue
EV/EBITDA: Enterprise value ÷ EBITDA
Price-to-free-cash-flow: Market value ÷ Free cash flow
The SEC’s investor guide similarly explains that ratios such as P/E, operating margin and debt-to-equity are derived from financial-statement information and used to evaluate companies.
The correct valuation metric depends on the business.
A mature profitable company may be reasonably evaluated using P/E.
A rapidly growing company with limited current earnings may require greater attention to revenue growth, gross margins, cash flow and enterprise value.
A capital-intensive infrastructure company may require a different framework again.
Four Companies Show Why the 12 Numbers Work Together
The easiest way to understand an earnings report is to apply the framework to real companies.
SMCI: Growth, margins and execution
Super Micro Computer is an excellent example because its business is closely tied to AI infrastructure demand.
Its latest fiscal Q4 report showed roughly $11.12 billion in revenue, while gross margin was around 17.5%. Management’s fiscal 2027 revenue forecast of $65 billion to $72 billion was significantly above the average Wall Street estimate cited by Reuters.
An investor looking only at revenue might conclude the report was weaker than expected.
An investor looking at all 12 numbers would ask:
Is gross-margin recovery sustainable?
Can the company convert its AI demand into profitable growth?
How much capital will be required?
How much cash does the company have?
How much debt does it carry?
And does the stock price already reflect the growth opportunity?
CRWV: Backlog versus capital intensity
CoreWeave provides a different lesson.
Its Q2 2026 revenue reached approximately $2.575 billion, up 112% year over year, while its revenue backlog climbed to roughly $104 billion.
That looks spectacular from a demand perspective.
But the company is also spending heavily on infrastructure and carrying substantial interest expense.
Therefore, the correct analysis is not simply:
“Revenue is growing rapidly.”
It is:
“Revenue is growing rapidly, backlog is enormous, but how much capital and financing does the company need to turn that demand into durable free cash flow?”
That is the difference between reading an earnings headline and analyzing an earnings report.
ORCL: Revenue quality and massive AI investment
Oracle offers another useful example.
Fiscal 2026 revenue reached $67.4 billion, up 17%, while total cloud revenue grew 39% to $34 billion. Cloud infrastructure revenue increased 77% to $18.1 billion.
At the same time, Oracle’s remaining performance obligations reached $638 billion, up 363% year over year.
That backlog-like contracted-revenue measure provides investors with visibility into future business.
But Oracle’s negative fiscal-year free cash flow also demonstrates why investors should never analyze growth without considering investment requirements.
PLTR: Growth, guidance and valuation
Palantir provides perhaps the clearest example of why valuation must remain on the checklist.
The company’s Q2 2026 revenue reached approximately $1.935 billion, up 93% year over year, and management raised its full-year 2026 revenue guidance.
Those are exceptional growth numbers.
But extraordinary growth can produce extraordinary expectations.
When investors assign a very high valuation to a fast-growing company, future earnings must continue to justify those expectations. A company can report excellent results and still see its stock decline if investors believe future growth will slow or if the valuation becomes too demanding.
That is why the 12th number—valuation—should always be considered after the operating performance has been understood.
What This Means for You
If you are a U.S. stock investor, you do not need to become an accountant to read earnings reports effectively.
Start with the income statement.
Ask whether revenue is growing and whether earnings are improving.
Then examine margins.
Move to the cash-flow statement and determine whether the company is actually generating cash.
Then inspect the balance sheet.
Look at cash, debt and liquidity.
After that, read management’s guidance and examine backlog or remaining performance obligations when those measures are relevant.
Finally, look at CapEx and valuation.
The SEC recommends investors understand the relationship between the income statement, balance sheet and cash-flow statement rather than relying on one financial statement alone.
That approach is especially important with high-growth companies, where revenue growth can look spectacular while cash requirements and financing needs are also enormous.
Investor Takeaway: The 12-Number Earnings Checklist
Investor takeaway: the best earnings analysis is not about finding the single biggest number in the press release.
It is about understanding the relationship between the numbers.
Use this checklist every time a company reports:
| Number | What it tells you |
|---|---|
| Revenue | How much business the company generated |
| Revenue growth | Whether the business is expanding |
| EPS | Profit attributable to each share |
| Gross margin | Economics of the core product/service |
| Operating margin | Efficiency after operating expenses |
| Free cash flow | Cash left after operating needs and CapEx |
| Cash | Financial liquidity |
| Debt | Financing obligations and balance-sheet risk |
| Guidance | Management’s expectations for the future |
| Backlog | Visibility into future contracted business |
| Capital expenditures | Cost of building future capacity |
| Valuation | What investors are paying for the business |
One more number deserves an unofficial place at the top of the list:
The change.
Investors should ask how each number changed compared with the same quarter last year and the previous quarter.
A $1 billion revenue number means little without context.
A $1 billion revenue number growing 50% tells a different story.
A 50% growth rate accompanied by collapsing margins tells another story.
And 50% growth with expanding margins, strong free cash flow, a healthy balance sheet and reasonable valuation tells another story entirely.
That is why earnings analysis is a process rather than a headline.
Future Outlook: How to Read the Next Earnings Report
Future outlook: earnings reports will remain one of the most important sources of information for stock investors because they provide a regular look at business performance, financial strength and management expectations.
The current AI infrastructure cycle makes the framework even more useful.
SMCI demonstrates the importance of margins and execution.
CRWV shows why backlog must be analyzed alongside CapEx, debt and cash flow.
ORCL demonstrates how extraordinary cloud growth can coexist with enormous infrastructure investment.
PLTR shows why exceptional growth does not eliminate valuation risk.
Those examples are different, but the same framework works across industries.
For a bank, investors might emphasize net interest income, credit losses and capital ratios.
For a retailer, inventory, same-store sales and gross margin may matter more.
For an industrial company, backlog, orders and CapEx could be crucial.
For a software company, recurring revenue, customer retention, margins and free cash flow may dominate the analysis.
The numbers change in importance, but the fundamental process remains the same.
What is the company selling?
Is demand growing?
Is the company becoming more profitable?
Does profit turn into cash?
Is the balance sheet strong enough to support the strategy?
What does management expect next?
How much investment is required?
And finally:
What price am I paying for all of it?
Those questions can turn a complicated 10-Q, 10-K or earnings release into a much more understandable investment story.
Before making an investment decision, investors should also read the company’s SEC filings and risk disclosures rather than relying solely on an earnings headline or third-party summary. The SEC’s guide to reading a 10-K specifically points investors toward the financial statements, management discussion, market-risk disclosures and critical accounting judgments.
An earnings report is not a buy or sell signal by itself.
It is a collection of evidence.
The investor’s job is to connect that evidence, identify what changed, understand why it changed and determine whether the current stock valuation already reflects the opportunity and the risks.
That is the skill that can remain useful through every earnings season.
Subscribe to trusted news sites like USnewsSphere.com for continuous updates.